Immigrants from Ethiopia vs Immigrants from Belize 2 or more Vehicles in Household
COMPARE
Immigrants from Ethiopia
Immigrants from Belize
2 or more Vehicles in Household
2 or more Vehicles in Household Comparison
Immigrants from Ethiopia
Immigrants from Belize
53.0%
2 OR MORE VEHICLES IN HOUSEHOLD
1.5/ 100
METRIC RATING
245th/ 347
METRIC RANK
49.9%
2 OR MORE VEHICLES IN HOUSEHOLD
0.0/ 100
METRIC RATING
304th/ 347
METRIC RANK
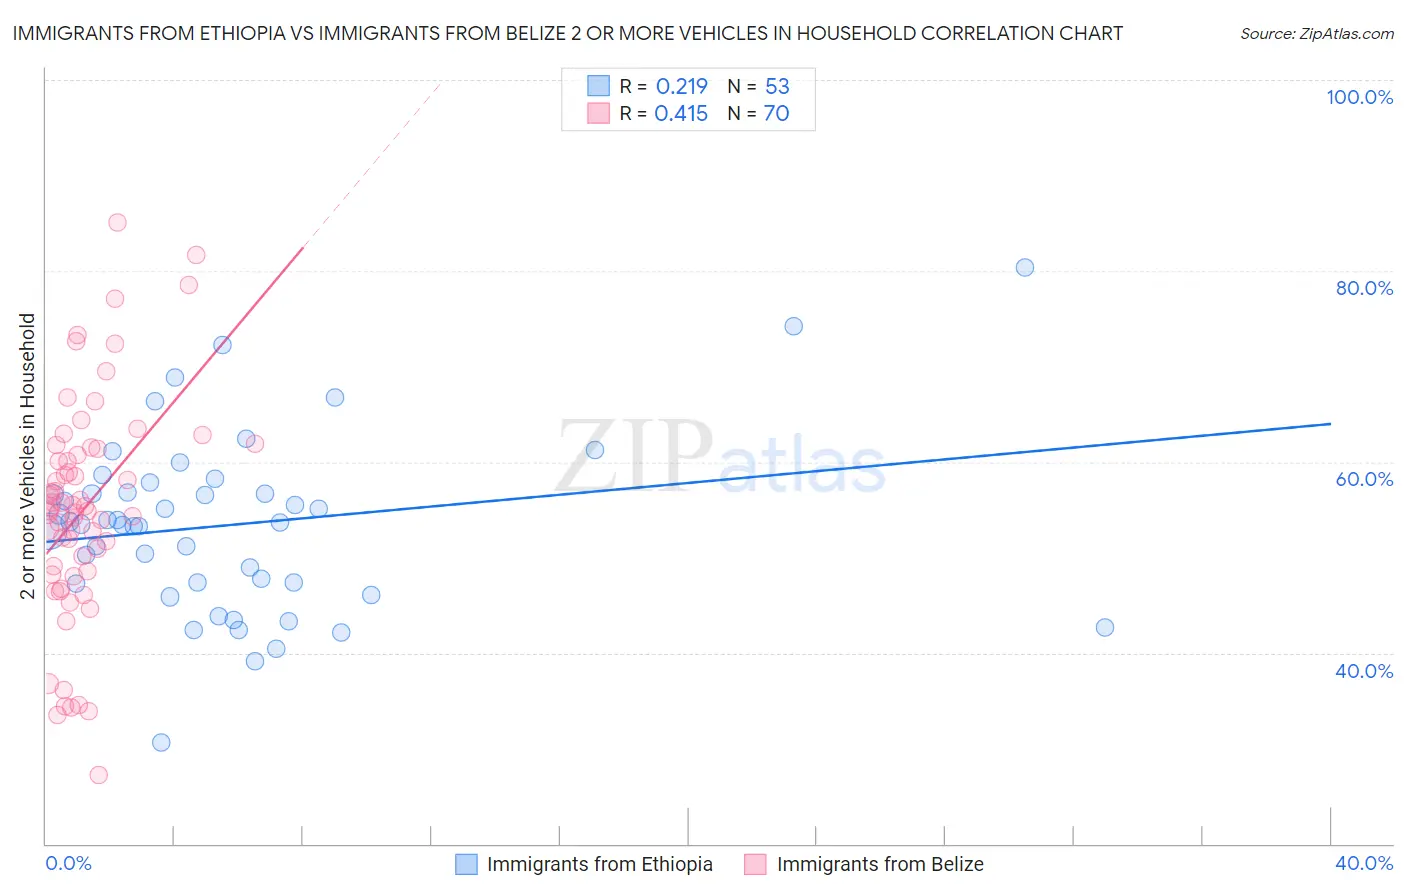
Immigrants from Ethiopia vs Immigrants from Belize 2 or more Vehicles in Household Correlation Chart
The statistical analysis conducted on geographies consisting of 211,485,366 people shows a weak positive correlation between the proportion of Immigrants from Ethiopia and percentage of households with 2 or more vehicles available in the United States with a correlation coefficient (R) of 0.219 and weighted average of 53.0%. Similarly, the statistical analysis conducted on geographies consisting of 130,296,303 people shows a moderate positive correlation between the proportion of Immigrants from Belize and percentage of households with 2 or more vehicles available in the United States with a correlation coefficient (R) of 0.415 and weighted average of 49.9%, a difference of 6.3%.
2 or more Vehicles in Household Correlation Summary
| Measurement | Immigrants from Ethiopia | Immigrants from Belize |
| Minimum | 30.6% | 27.2% |
| Maximum | 80.4% | 85.1% |
| Range | 49.7% | 57.9% |
| Mean | 53.4% | 55.1% |
| Median | 53.7% | 55.1% |
| Interquartile 25% (IQ1) | 47.3% | 48.6% |
| Interquartile 75% (IQ3) | 57.3% | 61.4% |
| Interquartile Range (IQR) | 10.0% | 12.9% |
| Standard Deviation (Sample) | 9.3% | 11.6% |
| Standard Deviation (Population) | 9.2% | 11.5% |
Similar Demographics by 2 or more Vehicles in Household
Demographics Similar to Immigrants from Ethiopia by 2 or more Vehicles in Household
In terms of 2 or more vehicles in household, the demographic groups most similar to Immigrants from Ethiopia are Indian (Asian) (53.1%, a difference of 0.12%), Ethiopian (53.1%, a difference of 0.16%), Immigrants from Nigeria (52.9%, a difference of 0.20%), Sierra Leonean (52.9%, a difference of 0.22%), and Immigrants from Eastern Asia (53.2%, a difference of 0.35%).
| Demographics | Rating | Rank | 2 or more Vehicles in Household |
| Immigrants | Armenia | 2.3 /100 | #238 | Tragic 53.3% |
| Cambodians | 2.3 /100 | #239 | Tragic 53.3% |
| Immigrants | Europe | 2.1 /100 | #240 | Tragic 53.2% |
| Immigrants | Sierra Leone | 2.1 /100 | #241 | Tragic 53.2% |
| Immigrants | Eastern Asia | 2.1 /100 | #242 | Tragic 53.2% |
| Ethiopians | 1.7 /100 | #243 | Tragic 53.1% |
| Indians (Asian) | 1.7 /100 | #244 | Tragic 53.1% |
| Immigrants | Ethiopia | 1.5 /100 | #245 | Tragic 53.0% |
| Immigrants | Nigeria | 1.2 /100 | #246 | Tragic 52.9% |
| Sierra Leoneans | 1.2 /100 | #247 | Tragic 52.9% |
| Colombians | 1.1 /100 | #248 | Tragic 52.9% |
| Immigrants | Brazil | 1.0 /100 | #249 | Tragic 52.8% |
| Mongolians | 1.0 /100 | #250 | Tragic 52.8% |
| Immigrants | Sudan | 1.0 /100 | #251 | Tragic 52.8% |
| Immigrants | Portugal | 1.0 /100 | #252 | Tragic 52.8% |
Demographics Similar to Immigrants from Belize by 2 or more Vehicles in Household
In terms of 2 or more vehicles in household, the demographic groups most similar to Immigrants from Belize are Tohono O'odham (50.0%, a difference of 0.20%), Immigrants from South America (50.2%, a difference of 0.57%), Immigrants from Greece (50.2%, a difference of 0.63%), Immigrants from Russia (50.3%, a difference of 0.81%), and Immigrants from Morocco (50.3%, a difference of 0.85%).
| Demographics | Rating | Rank | 2 or more Vehicles in Household |
| Immigrants | Spain | 0.0 /100 | #297 | Tragic 50.4% |
| Paraguayans | 0.0 /100 | #298 | Tragic 50.3% |
| Immigrants | Morocco | 0.0 /100 | #299 | Tragic 50.3% |
| Immigrants | Russia | 0.0 /100 | #300 | Tragic 50.3% |
| Immigrants | Greece | 0.0 /100 | #301 | Tragic 50.2% |
| Immigrants | South America | 0.0 /100 | #302 | Tragic 50.2% |
| Tohono O'odham | 0.0 /100 | #303 | Tragic 50.0% |
| Immigrants | Belize | 0.0 /100 | #304 | Tragic 49.9% |
| Immigrants | Western Africa | 0.0 /100 | #305 | Tragic 49.4% |
| Immigrants | Israel | 0.0 /100 | #306 | Tragic 49.2% |
| Hopi | 0.0 /100 | #307 | Tragic 49.0% |
| Albanians | 0.0 /100 | #308 | Tragic 49.0% |
| Moroccans | 0.0 /100 | #309 | Tragic 48.8% |
| Ghanaians | 0.0 /100 | #310 | Tragic 48.0% |
| Immigrants | Belarus | 0.0 /100 | #311 | Tragic 47.9% |