Immigrants from Lebanon vs Seminole 2 or more Vehicles in Household
COMPARE
Immigrants from Lebanon
Seminole
2 or more Vehicles in Household
2 or more Vehicles in Household Comparison
Immigrants from Lebanon
Seminole
57.2%
2 OR MORE VEHICLES IN HOUSEHOLD
96.8/ 100
METRIC RATING
114th/ 347
METRIC RANK
56.2%
2 OR MORE VEHICLES IN HOUSEHOLD
81.7/ 100
METRIC RATING
143rd/ 347
METRIC RANK
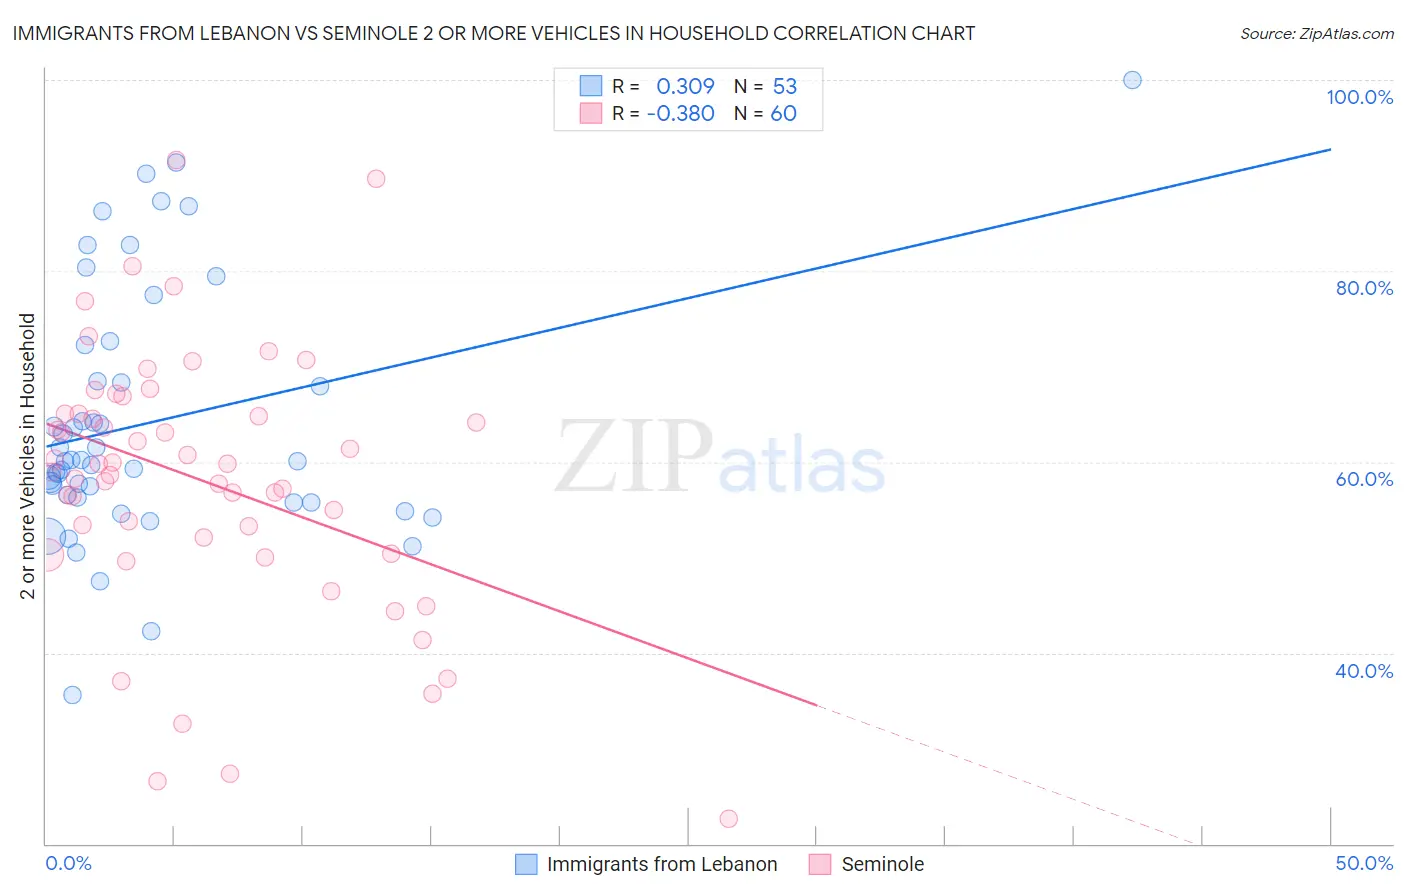
Immigrants from Lebanon vs Seminole 2 or more Vehicles in Household Correlation Chart
The statistical analysis conducted on geographies consisting of 217,126,913 people shows a mild positive correlation between the proportion of Immigrants from Lebanon and percentage of households with 2 or more vehicles available in the United States with a correlation coefficient (R) of 0.309 and weighted average of 57.2%. Similarly, the statistical analysis conducted on geographies consisting of 118,307,027 people shows a mild negative correlation between the proportion of Seminole and percentage of households with 2 or more vehicles available in the United States with a correlation coefficient (R) of -0.380 and weighted average of 56.2%, a difference of 1.9%.
2 or more Vehicles in Household Correlation Summary
| Measurement | Immigrants from Lebanon | Seminole |
| Minimum | 35.5% | 22.6% |
| Maximum | 100.0% | 91.7% |
| Range | 64.5% | 69.1% |
| Mean | 64.1% | 58.0% |
| Median | 60.1% | 59.3% |
| Interquartile 25% (IQ1) | 56.0% | 51.3% |
| Interquartile 75% (IQ3) | 70.4% | 65.0% |
| Interquartile Range (IQR) | 14.3% | 13.7% |
| Standard Deviation (Sample) | 13.2% | 13.9% |
| Standard Deviation (Population) | 13.1% | 13.8% |
Similar Demographics by 2 or more Vehicles in Household
Demographics Similar to Immigrants from Lebanon by 2 or more Vehicles in Household
In terms of 2 or more vehicles in household, the demographic groups most similar to Immigrants from Lebanon are Zimbabwean (57.2%, a difference of 0.030%), Chippewa (57.2%, a difference of 0.050%), Immigrants from Jordan (57.2%, a difference of 0.070%), Iraqi (57.1%, a difference of 0.26%), and Asian (57.0%, a difference of 0.42%).
| Demographics | Rating | Rank | 2 or more Vehicles in Household |
| Immigrants | Netherlands | 98.2 /100 | #107 | Exceptional 57.5% |
| Immigrants | Canada | 98.1 /100 | #108 | Exceptional 57.5% |
| Immigrants | North America | 98.1 /100 | #109 | Exceptional 57.5% |
| Japanese | 98.0 /100 | #110 | Exceptional 57.5% |
| Greeks | 98.0 /100 | #111 | Exceptional 57.5% |
| Pueblo | 98.0 /100 | #112 | Exceptional 57.5% |
| Zimbabweans | 96.9 /100 | #113 | Exceptional 57.2% |
| Immigrants | Lebanon | 96.8 /100 | #114 | Exceptional 57.2% |
| Chippewa | 96.6 /100 | #115 | Exceptional 57.2% |
| Immigrants | Jordan | 96.6 /100 | #116 | Exceptional 57.2% |
| Iraqis | 95.8 /100 | #117 | Exceptional 57.1% |
| Asians | 95.1 /100 | #118 | Exceptional 57.0% |
| Natives/Alaskans | 95.0 /100 | #119 | Exceptional 57.0% |
| Costa Ricans | 94.7 /100 | #120 | Exceptional 56.9% |
| Sioux | 93.8 /100 | #121 | Exceptional 56.8% |
Demographics Similar to Seminole by 2 or more Vehicles in Household
In terms of 2 or more vehicles in household, the demographic groups most similar to Seminole are Immigrants from Syria (56.2%, a difference of 0.020%), Syrian (56.2%, a difference of 0.030%), Venezuelan (56.1%, a difference of 0.070%), South African (56.2%, a difference of 0.090%), and Serbian (56.1%, a difference of 0.090%).
| Demographics | Rating | Rank | 2 or more Vehicles in Household |
| Immigrants | Asia | 86.0 /100 | #136 | Excellent 56.3% |
| Cubans | 84.8 /100 | #137 | Excellent 56.3% |
| Salvadorans | 84.7 /100 | #138 | Excellent 56.3% |
| Armenians | 84.3 /100 | #139 | Excellent 56.3% |
| Latvians | 83.6 /100 | #140 | Excellent 56.2% |
| Immigrants | Cambodia | 83.6 /100 | #141 | Excellent 56.2% |
| South Africans | 83.1 /100 | #142 | Excellent 56.2% |
| Seminole | 81.7 /100 | #143 | Excellent 56.2% |
| Immigrants | Syria | 81.4 /100 | #144 | Excellent 56.2% |
| Syrians | 81.2 /100 | #145 | Excellent 56.2% |
| Venezuelans | 80.7 /100 | #146 | Excellent 56.1% |
| Serbians | 80.3 /100 | #147 | Excellent 56.1% |
| Immigrants | Moldova | 80.2 /100 | #148 | Excellent 56.1% |
| Chileans | 80.2 /100 | #149 | Excellent 56.1% |
| Nicaraguans | 79.9 /100 | #150 | Good 56.1% |