Immigrants from Ethiopia vs Immigrants from Hungary 2 or more Vehicles in Household
COMPARE
Immigrants from Ethiopia
Immigrants from Hungary
2 or more Vehicles in Household
2 or more Vehicles in Household Comparison
Immigrants from Ethiopia
Immigrants from Hungary
53.0%
2 OR MORE VEHICLES IN HOUSEHOLD
1.5/ 100
METRIC RATING
245th/ 347
METRIC RANK
54.2%
2 OR MORE VEHICLES IN HOUSEHOLD
11.3/ 100
METRIC RATING
211th/ 347
METRIC RANK
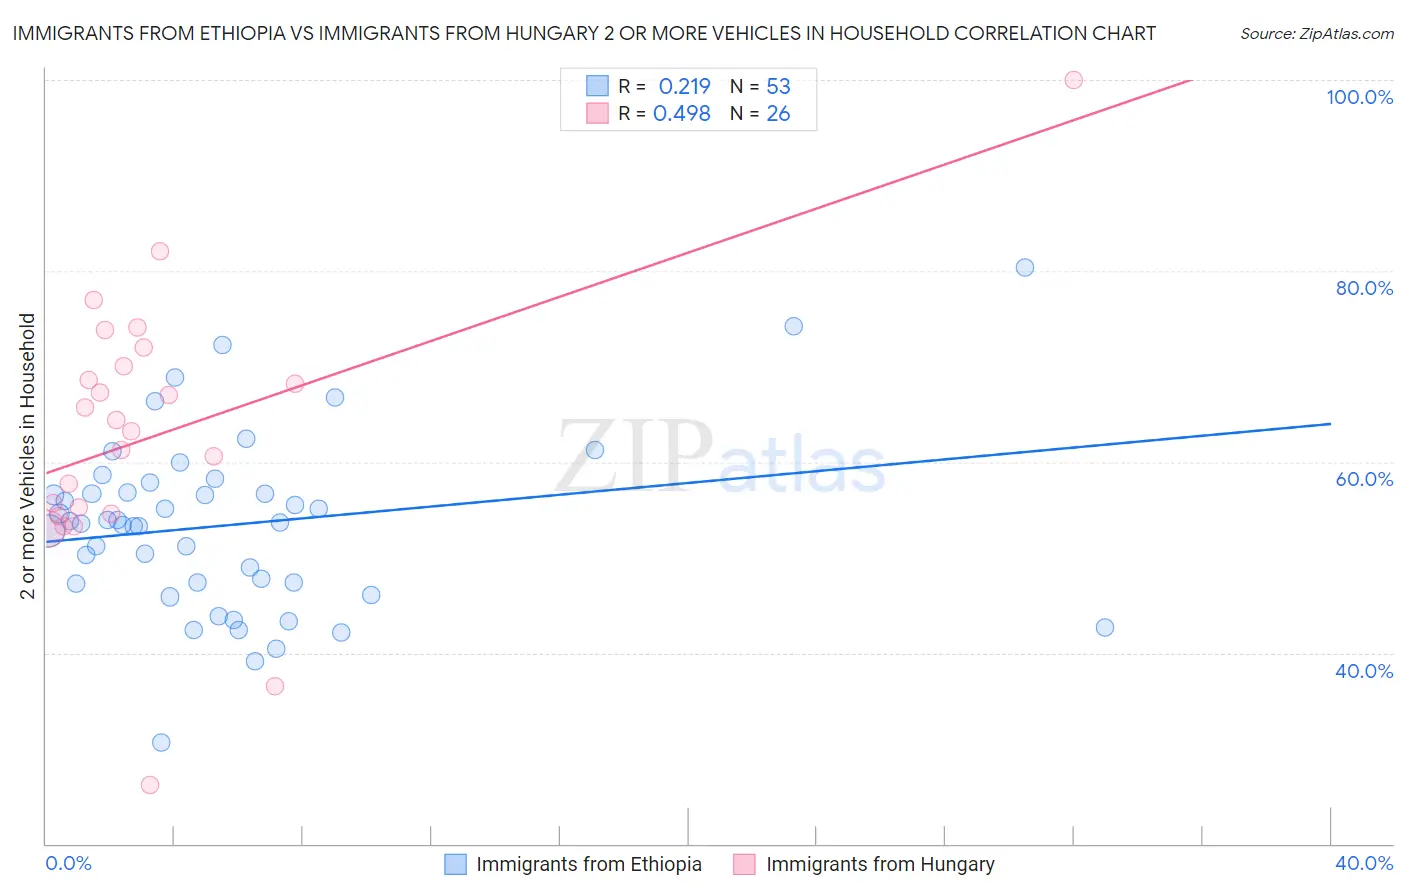
Immigrants from Ethiopia vs Immigrants from Hungary 2 or more Vehicles in Household Correlation Chart
The statistical analysis conducted on geographies consisting of 211,485,366 people shows a weak positive correlation between the proportion of Immigrants from Ethiopia and percentage of households with 2 or more vehicles available in the United States with a correlation coefficient (R) of 0.219 and weighted average of 53.0%. Similarly, the statistical analysis conducted on geographies consisting of 195,676,046 people shows a moderate positive correlation between the proportion of Immigrants from Hungary and percentage of households with 2 or more vehicles available in the United States with a correlation coefficient (R) of 0.498 and weighted average of 54.2%, a difference of 2.2%.
2 or more Vehicles in Household Correlation Summary
| Measurement | Immigrants from Ethiopia | Immigrants from Hungary |
| Minimum | 30.6% | 26.2% |
| Maximum | 80.4% | 100.0% |
| Range | 49.7% | 73.8% |
| Mean | 53.4% | 62.9% |
| Median | 53.7% | 63.8% |
| Interquartile 25% (IQ1) | 47.3% | 54.5% |
| Interquartile 75% (IQ3) | 57.3% | 70.1% |
| Interquartile Range (IQR) | 10.0% | 15.6% |
| Standard Deviation (Sample) | 9.3% | 14.2% |
| Standard Deviation (Population) | 9.2% | 13.9% |
Similar Demographics by 2 or more Vehicles in Household
Demographics Similar to Immigrants from Ethiopia by 2 or more Vehicles in Household
In terms of 2 or more vehicles in household, the demographic groups most similar to Immigrants from Ethiopia are Indian (Asian) (53.1%, a difference of 0.12%), Ethiopian (53.1%, a difference of 0.16%), Immigrants from Nigeria (52.9%, a difference of 0.20%), Sierra Leonean (52.9%, a difference of 0.22%), and Immigrants from Eastern Asia (53.2%, a difference of 0.35%).
| Demographics | Rating | Rank | 2 or more Vehicles in Household |
| Immigrants | Armenia | 2.3 /100 | #238 | Tragic 53.3% |
| Cambodians | 2.3 /100 | #239 | Tragic 53.3% |
| Immigrants | Europe | 2.1 /100 | #240 | Tragic 53.2% |
| Immigrants | Sierra Leone | 2.1 /100 | #241 | Tragic 53.2% |
| Immigrants | Eastern Asia | 2.1 /100 | #242 | Tragic 53.2% |
| Ethiopians | 1.7 /100 | #243 | Tragic 53.1% |
| Indians (Asian) | 1.7 /100 | #244 | Tragic 53.1% |
| Immigrants | Ethiopia | 1.5 /100 | #245 | Tragic 53.0% |
| Immigrants | Nigeria | 1.2 /100 | #246 | Tragic 52.9% |
| Sierra Leoneans | 1.2 /100 | #247 | Tragic 52.9% |
| Colombians | 1.1 /100 | #248 | Tragic 52.9% |
| Immigrants | Brazil | 1.0 /100 | #249 | Tragic 52.8% |
| Mongolians | 1.0 /100 | #250 | Tragic 52.8% |
| Immigrants | Sudan | 1.0 /100 | #251 | Tragic 52.8% |
| Immigrants | Portugal | 1.0 /100 | #252 | Tragic 52.8% |
Demographics Similar to Immigrants from Hungary by 2 or more Vehicles in Household
In terms of 2 or more vehicles in household, the demographic groups most similar to Immigrants from Hungary are Immigrants from Saudi Arabia (54.2%, a difference of 0.010%), Immigrants from Chile (54.2%, a difference of 0.020%), Egyptian (54.3%, a difference of 0.070%), Immigrants from Bulgaria (54.3%, a difference of 0.070%), and Turkish (54.3%, a difference of 0.16%).
| Demographics | Rating | Rank | 2 or more Vehicles in Household |
| Immigrants | Belgium | 13.7 /100 | #204 | Poor 54.3% |
| Cheyenne | 13.6 /100 | #205 | Poor 54.3% |
| Immigrants | Latin America | 13.1 /100 | #206 | Poor 54.3% |
| Turks | 13.0 /100 | #207 | Poor 54.3% |
| Egyptians | 12.0 /100 | #208 | Poor 54.3% |
| Immigrants | Bulgaria | 12.0 /100 | #209 | Poor 54.3% |
| Immigrants | Saudi Arabia | 11.3 /100 | #210 | Poor 54.2% |
| Immigrants | Hungary | 11.3 /100 | #211 | Poor 54.2% |
| Immigrants | Chile | 11.1 /100 | #212 | Poor 54.2% |
| Guatemalans | 9.6 /100 | #213 | Tragic 54.1% |
| Immigrants | Czechoslovakia | 9.4 /100 | #214 | Tragic 54.1% |
| Aleuts | 9.3 /100 | #215 | Tragic 54.1% |
| Immigrants | Western Asia | 9.3 /100 | #216 | Tragic 54.1% |
| Immigrants | Burma/Myanmar | 7.1 /100 | #217 | Tragic 53.9% |
| Immigrants | Argentina | 6.8 /100 | #218 | Tragic 53.9% |