Arapaho vs Seminole 2 or more Vehicles in Household
COMPARE
Arapaho
Seminole
2 or more Vehicles in Household
2 or more Vehicles in Household Comparison
Arapaho
Seminole
60.2%
2 OR MORE VEHICLES IN HOUSEHOLD
100.0/ 100
METRIC RATING
32nd/ 347
METRIC RANK
56.2%
2 OR MORE VEHICLES IN HOUSEHOLD
81.7/ 100
METRIC RATING
143rd/ 347
METRIC RANK
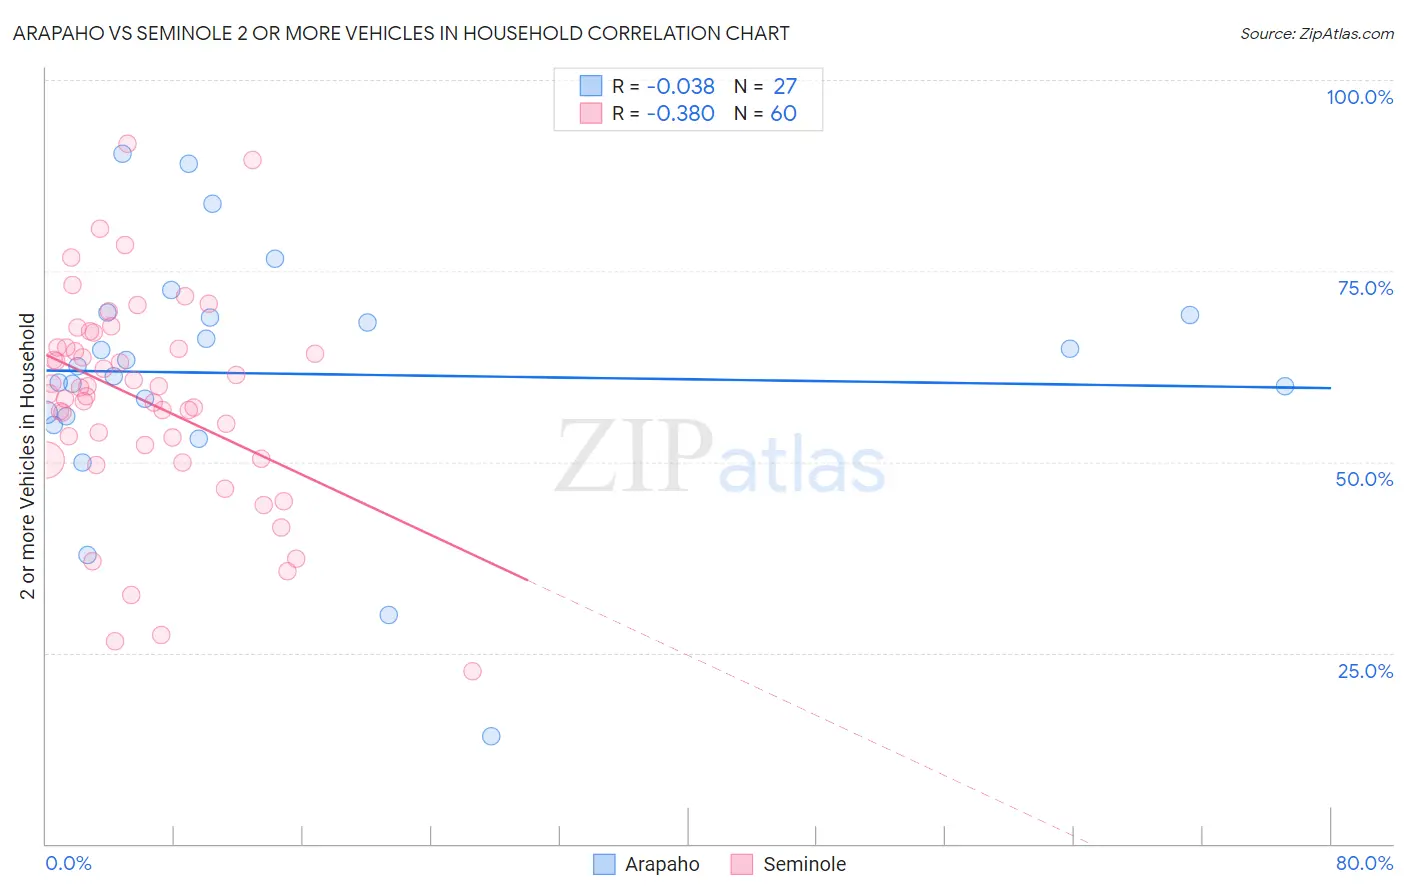
Arapaho vs Seminole 2 or more Vehicles in Household Correlation Chart
The statistical analysis conducted on geographies consisting of 29,778,572 people shows no correlation between the proportion of Arapaho and percentage of households with 2 or more vehicles available in the United States with a correlation coefficient (R) of -0.038 and weighted average of 60.2%. Similarly, the statistical analysis conducted on geographies consisting of 118,307,027 people shows a mild negative correlation between the proportion of Seminole and percentage of households with 2 or more vehicles available in the United States with a correlation coefficient (R) of -0.380 and weighted average of 56.2%, a difference of 7.2%.
2 or more Vehicles in Household Correlation Summary
| Measurement | Arapaho | Seminole |
| Minimum | 14.1% | 22.6% |
| Maximum | 90.3% | 91.7% |
| Range | 76.2% | 69.1% |
| Mean | 61.5% | 58.0% |
| Median | 62.5% | 59.3% |
| Interquartile 25% (IQ1) | 56.0% | 51.3% |
| Interquartile 75% (IQ3) | 69.3% | 65.0% |
| Interquartile Range (IQR) | 13.3% | 13.7% |
| Standard Deviation (Sample) | 16.2% | 13.9% |
| Standard Deviation (Population) | 15.9% | 13.8% |
Similar Demographics by 2 or more Vehicles in Household
Demographics Similar to Arapaho by 2 or more Vehicles in Household
In terms of 2 or more vehicles in household, the demographic groups most similar to Arapaho are Immigrants from Mexico (60.2%, a difference of 0.060%), Spanish American Indian (60.3%, a difference of 0.11%), Spanish (60.2%, a difference of 0.11%), Finnish (60.3%, a difference of 0.13%), and Immigrants from Philippines (60.1%, a difference of 0.23%).
| Demographics | Rating | Rank | 2 or more Vehicles in Household |
| Whites/Caucasians | 100.0 /100 | #25 | Exceptional 60.8% |
| Welsh | 100.0 /100 | #26 | Exceptional 60.8% |
| Assyrians/Chaldeans/Syriacs | 100.0 /100 | #27 | Exceptional 60.5% |
| Guamanians/Chamorros | 100.0 /100 | #28 | Exceptional 60.5% |
| Hawaiians | 100.0 /100 | #29 | Exceptional 60.4% |
| Finns | 100.0 /100 | #30 | Exceptional 60.3% |
| Spanish American Indians | 100.0 /100 | #31 | Exceptional 60.3% |
| Arapaho | 100.0 /100 | #32 | Exceptional 60.2% |
| Immigrants | Mexico | 100.0 /100 | #33 | Exceptional 60.2% |
| Spanish | 100.0 /100 | #34 | Exceptional 60.2% |
| Immigrants | Philippines | 100.0 /100 | #35 | Exceptional 60.1% |
| Chinese | 100.0 /100 | #36 | Exceptional 60.1% |
| Irish | 100.0 /100 | #37 | Exceptional 60.1% |
| Americans | 100.0 /100 | #38 | Exceptional 60.0% |
| British | 100.0 /100 | #39 | Exceptional 60.0% |
Demographics Similar to Seminole by 2 or more Vehicles in Household
In terms of 2 or more vehicles in household, the demographic groups most similar to Seminole are Immigrants from Syria (56.2%, a difference of 0.020%), Syrian (56.2%, a difference of 0.030%), Venezuelan (56.1%, a difference of 0.070%), South African (56.2%, a difference of 0.090%), and Serbian (56.1%, a difference of 0.090%).
| Demographics | Rating | Rank | 2 or more Vehicles in Household |
| Immigrants | Asia | 86.0 /100 | #136 | Excellent 56.3% |
| Cubans | 84.8 /100 | #137 | Excellent 56.3% |
| Salvadorans | 84.7 /100 | #138 | Excellent 56.3% |
| Armenians | 84.3 /100 | #139 | Excellent 56.3% |
| Latvians | 83.6 /100 | #140 | Excellent 56.2% |
| Immigrants | Cambodia | 83.6 /100 | #141 | Excellent 56.2% |
| South Africans | 83.1 /100 | #142 | Excellent 56.2% |
| Seminole | 81.7 /100 | #143 | Excellent 56.2% |
| Immigrants | Syria | 81.4 /100 | #144 | Excellent 56.2% |
| Syrians | 81.2 /100 | #145 | Excellent 56.2% |
| Venezuelans | 80.7 /100 | #146 | Excellent 56.1% |
| Serbians | 80.3 /100 | #147 | Excellent 56.1% |
| Immigrants | Moldova | 80.2 /100 | #148 | Excellent 56.1% |
| Chileans | 80.2 /100 | #149 | Excellent 56.1% |
| Nicaraguans | 79.9 /100 | #150 | Good 56.1% |