Immigrants from Armenia vs Seminole 2 or more Vehicles in Household
COMPARE
Immigrants from Armenia
Seminole
2 or more Vehicles in Household
2 or more Vehicles in Household Comparison
Immigrants from Armenia
Seminole
53.3%
2 OR MORE VEHICLES IN HOUSEHOLD
2.3/ 100
METRIC RATING
238th/ 347
METRIC RANK
56.2%
2 OR MORE VEHICLES IN HOUSEHOLD
81.7/ 100
METRIC RATING
143rd/ 347
METRIC RANK
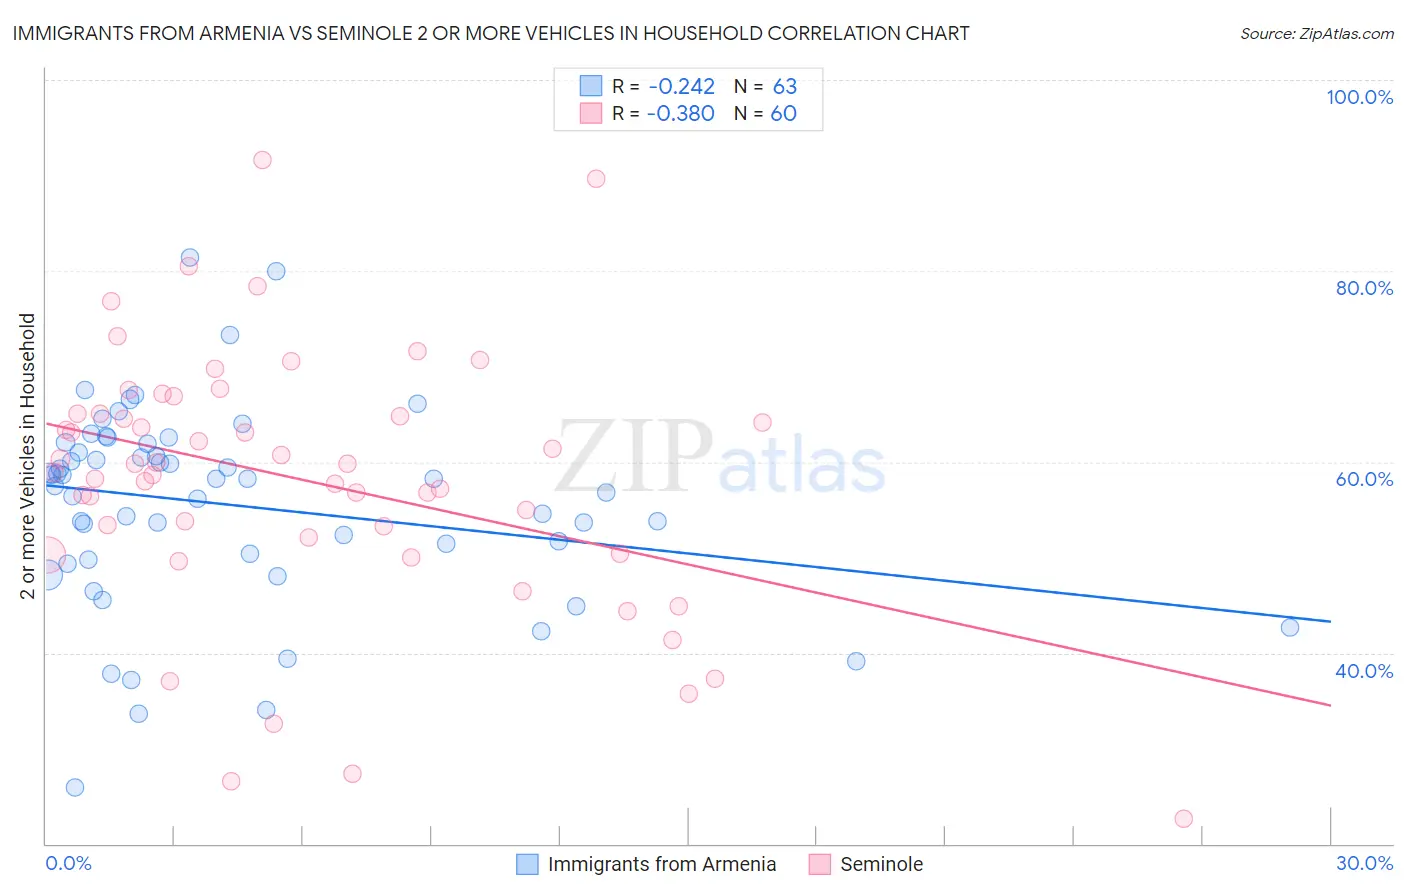
Immigrants from Armenia vs Seminole 2 or more Vehicles in Household Correlation Chart
The statistical analysis conducted on geographies consisting of 97,683,198 people shows a weak negative correlation between the proportion of Immigrants from Armenia and percentage of households with 2 or more vehicles available in the United States with a correlation coefficient (R) of -0.242 and weighted average of 53.3%. Similarly, the statistical analysis conducted on geographies consisting of 118,307,027 people shows a mild negative correlation between the proportion of Seminole and percentage of households with 2 or more vehicles available in the United States with a correlation coefficient (R) of -0.380 and weighted average of 56.2%, a difference of 5.4%.
2 or more Vehicles in Household Correlation Summary
| Measurement | Immigrants from Armenia | Seminole |
| Minimum | 25.8% | 22.6% |
| Maximum | 81.4% | 91.7% |
| Range | 55.6% | 69.1% |
| Mean | 55.5% | 58.0% |
| Median | 58.2% | 59.3% |
| Interquartile 25% (IQ1) | 49.7% | 51.3% |
| Interquartile 75% (IQ3) | 61.9% | 65.0% |
| Interquartile Range (IQR) | 12.2% | 13.7% |
| Standard Deviation (Sample) | 10.5% | 13.9% |
| Standard Deviation (Population) | 10.4% | 13.8% |
Similar Demographics by 2 or more Vehicles in Household
Demographics Similar to Immigrants from Armenia by 2 or more Vehicles in Household
In terms of 2 or more vehicles in household, the demographic groups most similar to Immigrants from Armenia are Cambodian (53.3%, a difference of 0.010%), Macedonian (53.3%, a difference of 0.070%), Immigrants from Europe (53.2%, a difference of 0.070%), Immigrants from Sierra Leone (53.2%, a difference of 0.10%), and Immigrants from Eastern Asia (53.2%, a difference of 0.11%).
| Demographics | Rating | Rank | 2 or more Vehicles in Household |
| Panamanians | 3.4 /100 | #231 | Tragic 53.5% |
| Immigrants | Guatemala | 3.2 /100 | #232 | Tragic 53.5% |
| Ugandans | 3.2 /100 | #233 | Tragic 53.5% |
| Immigrants | Switzerland | 3.0 /100 | #234 | Tragic 53.4% |
| Immigrants | Middle Africa | 3.0 /100 | #235 | Tragic 53.4% |
| Indonesians | 2.7 /100 | #236 | Tragic 53.4% |
| Macedonians | 2.4 /100 | #237 | Tragic 53.3% |
| Immigrants | Armenia | 2.3 /100 | #238 | Tragic 53.3% |
| Cambodians | 2.3 /100 | #239 | Tragic 53.3% |
| Immigrants | Europe | 2.1 /100 | #240 | Tragic 53.2% |
| Immigrants | Sierra Leone | 2.1 /100 | #241 | Tragic 53.2% |
| Immigrants | Eastern Asia | 2.1 /100 | #242 | Tragic 53.2% |
| Ethiopians | 1.7 /100 | #243 | Tragic 53.1% |
| Indians (Asian) | 1.7 /100 | #244 | Tragic 53.1% |
| Immigrants | Ethiopia | 1.5 /100 | #245 | Tragic 53.0% |
Demographics Similar to Seminole by 2 or more Vehicles in Household
In terms of 2 or more vehicles in household, the demographic groups most similar to Seminole are Immigrants from Syria (56.2%, a difference of 0.020%), Syrian (56.2%, a difference of 0.030%), Venezuelan (56.1%, a difference of 0.070%), South African (56.2%, a difference of 0.090%), and Serbian (56.1%, a difference of 0.090%).
| Demographics | Rating | Rank | 2 or more Vehicles in Household |
| Immigrants | Asia | 86.0 /100 | #136 | Excellent 56.3% |
| Cubans | 84.8 /100 | #137 | Excellent 56.3% |
| Salvadorans | 84.7 /100 | #138 | Excellent 56.3% |
| Armenians | 84.3 /100 | #139 | Excellent 56.3% |
| Latvians | 83.6 /100 | #140 | Excellent 56.2% |
| Immigrants | Cambodia | 83.6 /100 | #141 | Excellent 56.2% |
| South Africans | 83.1 /100 | #142 | Excellent 56.2% |
| Seminole | 81.7 /100 | #143 | Excellent 56.2% |
| Immigrants | Syria | 81.4 /100 | #144 | Excellent 56.2% |
| Syrians | 81.2 /100 | #145 | Excellent 56.2% |
| Venezuelans | 80.7 /100 | #146 | Excellent 56.1% |
| Serbians | 80.3 /100 | #147 | Excellent 56.1% |
| Immigrants | Moldova | 80.2 /100 | #148 | Excellent 56.1% |
| Chileans | 80.2 /100 | #149 | Excellent 56.1% |
| Nicaraguans | 79.9 /100 | #150 | Good 56.1% |