Immigrants from Western Europe vs Immigrants from Hungary 2 or more Vehicles in Household

COMPARE

Immigrants from Western Europe
Race
Ancestry
AfghanAfricanAlaska NativeAlaskan AthabascanAlbanianAleutAlsatianAmericanApacheArabArapahoArgentineanArmenianAssyrian/Chaldean/SyriacAustralianAustrianBahamianBangladeshiBarbadianBasqueBelgianBelizeanBermudanBhutaneseBlackfeetBolivianBrazilianBritishBritish West IndianBulgarianBurmeseCajunCambodianCanadianCape VerdeanCarpatho RusynCelticCentral AmericanCentral American IndianCherokeeCheyenneChickasawChileanChineseChippewaChoctawColombianColvilleComancheCosta RicanCreeCreekCroatianCrowCubanCypriotCzechCzechoslovakianDanishDelawareDominicanDutchDutch West IndianEastern EuropeanEcuadorianEgyptianEnglishEstonianEthiopianEuropeanFijianFilipinoFinnishFrenchFrench American IndianFrench CanadianGermanGerman RussianGhanaianGreekGuamanian/ChamorroGuatemalanGuyaneseHaitianHmongHonduranHopiHoumaHungarianIcelanderIndian (Asian)IndonesianInupiatIranianIraqiIrishIroquoisIsraeliItalianJamaicanJapaneseJordanianKenyanKiowaKoreanLaotianLatvianLebaneseLiberianLithuanianLumbeeLuxembourgerMacedonianMalaysianMalteseMarshalleseMenomineeMexicanMexican American IndianMongolianMoroccanNative HawaiianNavajoNepaleseNew ZealanderNicaraguanNigerianNorthern EuropeanNorwegianOkinawanOsageOttawaPaiutePakistaniPalestinianPanamanianParaguayanPennsylvania GermanPeruvianPimaPolishPortuguesePotawatomiPuebloPuerto RicanPuget Sound SalishRomanianRussianSalvadoranSamoanScandinavianScotch-IrishScottishSeminoleSenegaleseSerbianShoshoneSierra LeoneanSiouxSlavicSlovakSloveneSomaliSouth AfricanSouth AmericanSouth American IndianSoviet UnionSpaniardSpanishSpanish AmericanSpanish American IndianSri LankanSubsaharan AfricanSudaneseSwedishSwissSyrianTaiwaneseThaiTlingit-HaidaTohono O'OdhamTonganTrinidadian and TobagonianTsimshianTurkishU.S. Virgin IslanderUgandanUkrainianUruguayanUteVenezuelanVietnameseWelshWest IndianYakamaYaquiYugoslavianYumanYup'ikZimbabwean
Immigration
NonimmigrantsImmigrantsAfghanistanAfricaAlbaniaArgentinaArmeniaAsiaAustraliaAustriaBahamasBangladeshBarbadosBelarusBelgiumBelizeBoliviaBosnia and HerzegovinaBrazilBulgariaBurma/MyanmarCabo VerdeCambodiaCameroonCanadaCaribbeanCentral AmericaChileChinaColombiaCongoCosta RicaCroatiaCubaCzechoslovakiaDenmarkDominicaDominican RepublicEastern AfricaEastern AsiaEastern EuropeEcuadorEgyptEl SalvadorEnglandEritreaEthiopiaEuropeFijiFranceGermanyGhanaGreeceGrenadaGuatemalaGuyanaHaitiHondurasHong KongIndiaIndonesiaIranIraqIrelandIsraelItalyJamaicaJapanJordanKazakhstanKenyaKoreaKuwaitLaosLatin AmericaLatviaLebanonLiberiaLithuaniaMalaysiaMexicoMicronesiaMiddle AfricaMoldovaMoroccoNepalNetherlandsNicaraguaNigeriaNorth AmericaNorth MacedoniaNorthern AfricaNorthern EuropeNorwayOceaniaPakistanPanamaPeruPhilippinesPolandPortugalRomaniaRussiaSaudi ArabiaScotlandSenegalSerbiaSierra LeoneSingaporeSomaliaSouth AfricaSouth AmericaSouth Central AsiaSouth Eastern AsiaSouthern EuropeSpainSri LankaSt. Vincent and the GrenadinesSudanSwedenSwitzerlandSyriaTaiwanThailandTrinidad and TobagoTurkeyUgandaUkraineUruguayUzbekistanVenezuelaVietnamWest IndiesWestern AfricaWestern AsiaWestern EuropeYemenZaireZimbabweAzores
Immigrants from Hungary
Race
Ancestry
AfghanAfricanAlaska NativeAlaskan AthabascanAlbanianAleutAlsatianAmericanApacheArabArapahoArgentineanArmenianAssyrian/Chaldean/SyriacAustralianAustrianBahamianBangladeshiBarbadianBasqueBelgianBelizeanBermudanBhutaneseBlackfeetBolivianBrazilianBritishBritish West IndianBulgarianBurmeseCajunCambodianCanadianCape VerdeanCarpatho RusynCelticCentral AmericanCentral American IndianCherokeeCheyenneChickasawChileanChineseChippewaChoctawColombianColvilleComancheCosta RicanCreeCreekCroatianCrowCubanCypriotCzechCzechoslovakianDanishDelawareDominicanDutchDutch West IndianEastern EuropeanEcuadorianEgyptianEnglishEstonianEthiopianEuropeanFijianFilipinoFinnishFrenchFrench American IndianFrench CanadianGermanGerman RussianGhanaianGreekGuamanian/ChamorroGuatemalanGuyaneseHaitianHmongHonduranHopiHoumaHungarianIcelanderIndian (Asian)IndonesianInupiatIranianIraqiIrishIroquoisIsraeliItalianJamaicanJapaneseJordanianKenyanKiowaKoreanLaotianLatvianLebaneseLiberianLithuanianLumbeeLuxembourgerMacedonianMalaysianMalteseMarshalleseMenomineeMexicanMexican American IndianMongolianMoroccanNative HawaiianNavajoNepaleseNew ZealanderNicaraguanNigerianNorthern EuropeanNorwegianOkinawanOsageOttawaPaiutePakistaniPalestinianPanamanianParaguayanPennsylvania GermanPeruvianPimaPolishPortuguesePotawatomiPuebloPuerto RicanPuget Sound SalishRomanianRussianSalvadoranSamoanScandinavianScotch-IrishScottishSeminoleSenegaleseSerbianShoshoneSierra LeoneanSiouxSlavicSlovakSloveneSomaliSouth AfricanSouth AmericanSouth American IndianSoviet UnionSpaniardSpanishSpanish AmericanSpanish American IndianSri LankanSubsaharan AfricanSudaneseSwedishSwissSyrianTaiwaneseThaiTlingit-HaidaTohono O'OdhamTonganTrinidadian and TobagonianTsimshianTurkishU.S. Virgin IslanderUgandanUkrainianUruguayanUteVenezuelanVietnameseWelshWest IndianYakamaYaquiYugoslavianYumanYup'ikZimbabwean
Immigration
NonimmigrantsImmigrantsAfghanistanAfricaAlbaniaArgentinaArmeniaAsiaAustraliaAustriaBahamasBangladeshBarbadosBelarusBelgiumBelizeBoliviaBosnia and HerzegovinaBrazilBulgariaBurma/MyanmarCabo VerdeCambodiaCameroonCanadaCaribbeanCentral AmericaChileChinaColombiaCongoCosta RicaCroatiaCubaCzechoslovakiaDenmarkDominicaDominican RepublicEastern AfricaEastern AsiaEastern EuropeEcuadorEgyptEl SalvadorEnglandEritreaEthiopiaEuropeFijiFranceGermanyGhanaGreeceGrenadaGuatemalaGuyanaHaitiHondurasHong KongHungaryIndiaIndonesiaIranIraqIrelandIsraelItalyJamaicaJapanJordanKazakhstanKenyaKoreaKuwaitLaosLatin AmericaLatviaLebanonLiberiaLithuaniaMalaysiaMexicoMicronesiaMiddle AfricaMoldovaMoroccoNepalNetherlandsNicaraguaNigeriaNorth AmericaNorth MacedoniaNorthern AfricaNorthern EuropeNorwayOceaniaPakistanPanamaPeruPhilippinesPolandPortugalRomaniaRussiaSaudi ArabiaScotlandSenegalSerbiaSierra LeoneSingaporeSomaliaSouth AfricaSouth AmericaSouth Central AsiaSouth Eastern AsiaSouthern EuropeSpainSri LankaSt. Vincent and the GrenadinesSudanSwedenSwitzerlandSyriaTaiwanThailandTrinidad and TobagoTurkeyUgandaUkraineUruguayUzbekistanVenezuelaVietnamWest IndiesWestern AfricaWestern AsiaYemenZaireZimbabweAzores
2 or more Vehicles in Household
Income
Poverty
Unemployment
Labor Participation
Family Structure
Vehicle Availability
Education Level
Disability

2 or more Vehicles in Household Comparison

Immigrants from Western Europe

Immigrants from Hungary

Average
Poor
55.4%
2 OR MORE VEHICLES IN HOUSEHOLD
51.4/ 100
METRIC RATING
173rd/ 347
METRIC RANK
54.2%
2 OR MORE VEHICLES IN HOUSEHOLD
11.3/ 100
METRIC RATING
211th/ 347
METRIC RANK

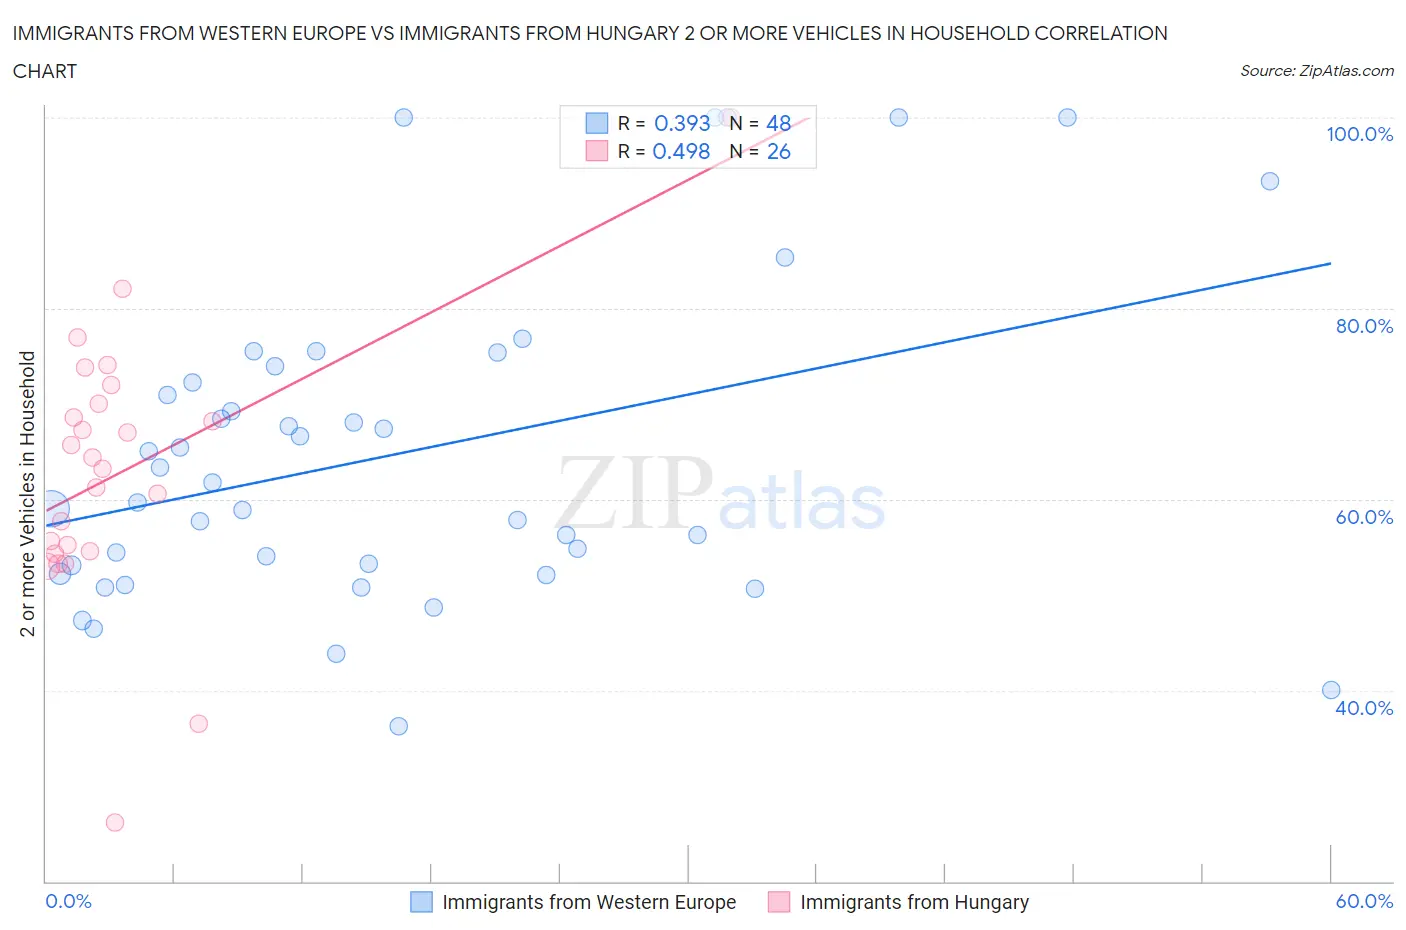
Immigrants from Western Europe vs Immigrants from Hungary 2 or more Vehicles in Household Correlation Chart

The statistical analysis conducted on geographies consisting of 493,846,859 people shows a mild positive correlation between the proportion of Immigrants from Western Europe and percentage of households with 2 or more vehicles available in the United States with a correlation coefficient (R) of 0.393 and weighted average of 55.4%. Similarly, the statistical analysis conducted on geographies consisting of 195,676,046 people shows a moderate positive correlation between the proportion of Immigrants from Hungary and percentage of households with 2 or more vehicles available in the United States with a correlation coefficient (R) of 0.498 and weighted average of 54.2%, a difference of 2.1%.
Immigrants from Western Europe vs Immigrants from Hungary 2 or more Vehicles in Household

2 or more Vehicles in Household Correlation Summary

MeasurementImmigrants from Western EuropeImmigrants from Hungary
Minimum36.3%26.2%
Maximum100.0%100.0%
Range63.7%73.8%
Mean64.7%62.9%
Median60.8%63.8%
Interquartile 25% (IQ1)52.7%54.5%
Interquartile 75% (IQ3)73.1%70.1%
Interquartile Range (IQR)20.5%15.6%
Standard Deviation (Sample)16.6%14.2%
Standard Deviation (Population)16.4%13.9%

Similar Demographics by 2 or more Vehicles in Household

Demographics Similar to Immigrants from Western Europe by 2 or more Vehicles in Household

In terms of 2 or more vehicles in household, the demographic groups most similar to Immigrants from Western Europe are Immigrants from Nicaragua (55.4%, a difference of 0.010%), Navajo (55.3%, a difference of 0.050%), Immigrants from Denmark (55.3%, a difference of 0.080%), Immigrants from Costa Rica (55.4%, a difference of 0.12%), and Immigrants from Cuba (55.3%, a difference of 0.17%).
DemographicsRating | Rank2 or more Vehicles in Household
Immigrants | Sri Lanka
58.3
/100
|
#166
Average
55.5%
Kenyans
58.1
/100
|
#167
Average
55.5%
French American Indians
56.7
/100
|
#168
Average
55.5%
Immigrants | Austria
56.3
/100
|
#169
Average
55.5%
Romanians
55.8
/100
|
#170
Average
55.5%
Immigrants | Costa Rica
54.4
/100
|
#171
Average
55.4%
Immigrants | Nicaragua
51.6
/100
|
#172
Average
55.4%
Immigrants | Western Europe
51.4
/100
|
#173
Average
55.4%
Navajo
50.0
/100
|
#174
Average
55.3%
Immigrants | Denmark
49.4
/100
|
#175
Average
55.3%
Immigrants | Cuba
47.0
/100
|
#176
Average
55.3%
Menominee
46.2
/100
|
#177
Average
55.3%
Immigrants | Sweden
45.3
/100
|
#178
Average
55.2%
Alaskan Athabascans
42.9
/100
|
#179
Average
55.2%
Immigrants | Kenya
40.4
/100
|
#180
Average
55.1%

Demographics Similar to Immigrants from Hungary by 2 or more Vehicles in Household

In terms of 2 or more vehicles in household, the demographic groups most similar to Immigrants from Hungary are Immigrants from Saudi Arabia (54.2%, a difference of 0.010%), Immigrants from Chile (54.2%, a difference of 0.020%), Egyptian (54.3%, a difference of 0.070%), Immigrants from Bulgaria (54.3%, a difference of 0.070%), and Turkish (54.3%, a difference of 0.16%).
DemographicsRating | Rank2 or more Vehicles in Household
Immigrants | Belgium
13.7
/100
|
#204
Poor
54.3%
Cheyenne
13.6
/100
|
#205
Poor
54.3%
Immigrants | Latin America
13.1
/100
|
#206
Poor
54.3%
Turks
13.0
/100
|
#207
Poor
54.3%
Egyptians
12.0
/100
|
#208
Poor
54.3%
Immigrants | Bulgaria
12.0
/100
|
#209
Poor
54.3%
Immigrants | Saudi Arabia
11.3
/100
|
#210
Poor
54.2%
Immigrants | Hungary
11.3
/100
|
#211
Poor
54.2%
Immigrants | Chile
11.1
/100
|
#212
Poor
54.2%
Guatemalans
9.6
/100
|
#213
Tragic
54.1%
Immigrants | Czechoslovakia
9.4
/100
|
#214
Tragic
54.1%
Aleuts
9.3
/100
|
#215
Tragic
54.1%
Immigrants | Western Asia
9.3
/100
|
#216
Tragic
54.1%
Immigrants | Burma/Myanmar
7.1
/100
|
#217
Tragic
53.9%
Immigrants | Argentina
6.8
/100
|
#218
Tragic
53.9%