Immigrants from Guatemala vs Immigrants from Hungary 2 or more Vehicles in Household
COMPARE
Immigrants from Guatemala
Immigrants from Hungary
2 or more Vehicles in Household
2 or more Vehicles in Household Comparison
Immigrants from Guatemala
Immigrants from Hungary
53.5%
2 OR MORE VEHICLES IN HOUSEHOLD
3.2/ 100
METRIC RATING
232nd/ 347
METRIC RANK
54.2%
2 OR MORE VEHICLES IN HOUSEHOLD
11.3/ 100
METRIC RATING
211th/ 347
METRIC RANK
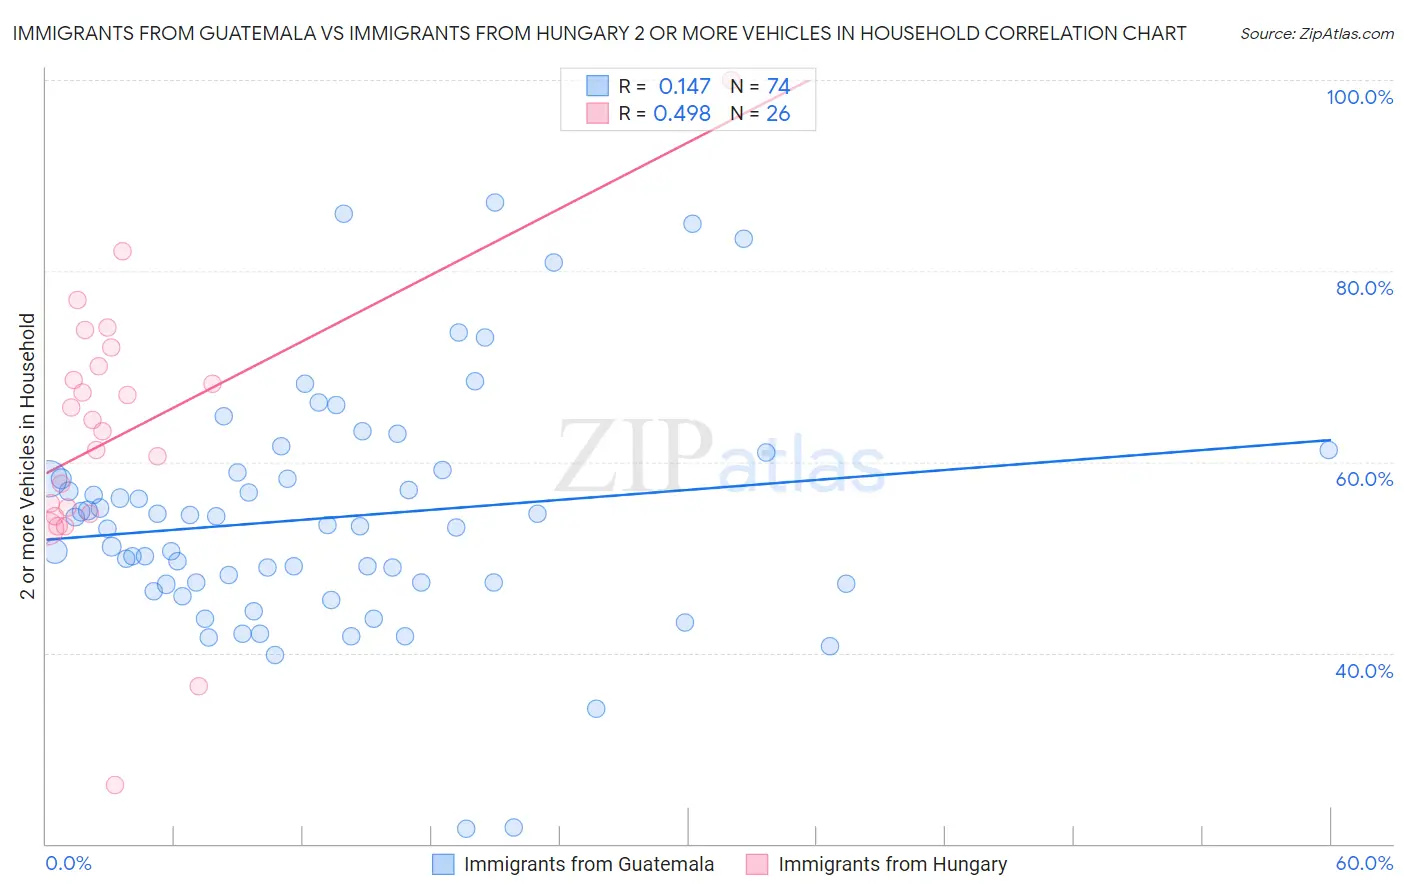
Immigrants from Guatemala vs Immigrants from Hungary 2 or more Vehicles in Household Correlation Chart
The statistical analysis conducted on geographies consisting of 377,175,695 people shows a poor positive correlation between the proportion of Immigrants from Guatemala and percentage of households with 2 or more vehicles available in the United States with a correlation coefficient (R) of 0.147 and weighted average of 53.5%. Similarly, the statistical analysis conducted on geographies consisting of 195,676,046 people shows a moderate positive correlation between the proportion of Immigrants from Hungary and percentage of households with 2 or more vehicles available in the United States with a correlation coefficient (R) of 0.498 and weighted average of 54.2%, a difference of 1.4%.
2 or more Vehicles in Household Correlation Summary
| Measurement | Immigrants from Guatemala | Immigrants from Hungary |
| Minimum | 21.5% | 26.2% |
| Maximum | 87.2% | 100.0% |
| Range | 65.7% | 73.8% |
| Mean | 54.1% | 62.9% |
| Median | 53.3% | 63.8% |
| Interquartile 25% (IQ1) | 47.2% | 54.5% |
| Interquartile 75% (IQ3) | 58.9% | 70.1% |
| Interquartile Range (IQR) | 11.7% | 15.6% |
| Standard Deviation (Sample) | 12.5% | 14.2% |
| Standard Deviation (Population) | 12.4% | 13.9% |
Similar Demographics by 2 or more Vehicles in Household
Demographics Similar to Immigrants from Guatemala by 2 or more Vehicles in Household
In terms of 2 or more vehicles in household, the demographic groups most similar to Immigrants from Guatemala are Ugandan (53.5%, a difference of 0.010%), Immigrants from Switzerland (53.4%, a difference of 0.060%), Panamanian (53.5%, a difference of 0.070%), Immigrants from Middle Africa (53.4%, a difference of 0.090%), and Immigrants from Nepal (53.5%, a difference of 0.12%).
| Demographics | Rating | Rank | 2 or more Vehicles in Household |
| Immigrants | Egypt | 5.2 /100 | #225 | Tragic 53.8% |
| Immigrants | Eastern Africa | 5.1 /100 | #226 | Tragic 53.7% |
| Sudanese | 4.1 /100 | #227 | Tragic 53.6% |
| Alaska Natives | 3.9 /100 | #228 | Tragic 53.6% |
| Immigrants | Turkey | 3.8 /100 | #229 | Tragic 53.6% |
| Immigrants | Nepal | 3.6 /100 | #230 | Tragic 53.5% |
| Panamanians | 3.4 /100 | #231 | Tragic 53.5% |
| Immigrants | Guatemala | 3.2 /100 | #232 | Tragic 53.5% |
| Ugandans | 3.2 /100 | #233 | Tragic 53.5% |
| Immigrants | Switzerland | 3.0 /100 | #234 | Tragic 53.4% |
| Immigrants | Middle Africa | 3.0 /100 | #235 | Tragic 53.4% |
| Indonesians | 2.7 /100 | #236 | Tragic 53.4% |
| Macedonians | 2.4 /100 | #237 | Tragic 53.3% |
| Immigrants | Armenia | 2.3 /100 | #238 | Tragic 53.3% |
| Cambodians | 2.3 /100 | #239 | Tragic 53.3% |
Demographics Similar to Immigrants from Hungary by 2 or more Vehicles in Household
In terms of 2 or more vehicles in household, the demographic groups most similar to Immigrants from Hungary are Immigrants from Saudi Arabia (54.2%, a difference of 0.010%), Immigrants from Chile (54.2%, a difference of 0.020%), Egyptian (54.3%, a difference of 0.070%), Immigrants from Bulgaria (54.3%, a difference of 0.070%), and Turkish (54.3%, a difference of 0.16%).
| Demographics | Rating | Rank | 2 or more Vehicles in Household |
| Immigrants | Belgium | 13.7 /100 | #204 | Poor 54.3% |
| Cheyenne | 13.6 /100 | #205 | Poor 54.3% |
| Immigrants | Latin America | 13.1 /100 | #206 | Poor 54.3% |
| Turks | 13.0 /100 | #207 | Poor 54.3% |
| Egyptians | 12.0 /100 | #208 | Poor 54.3% |
| Immigrants | Bulgaria | 12.0 /100 | #209 | Poor 54.3% |
| Immigrants | Saudi Arabia | 11.3 /100 | #210 | Poor 54.2% |
| Immigrants | Hungary | 11.3 /100 | #211 | Poor 54.2% |
| Immigrants | Chile | 11.1 /100 | #212 | Poor 54.2% |
| Guatemalans | 9.6 /100 | #213 | Tragic 54.1% |
| Immigrants | Czechoslovakia | 9.4 /100 | #214 | Tragic 54.1% |
| Aleuts | 9.3 /100 | #215 | Tragic 54.1% |
| Immigrants | Western Asia | 9.3 /100 | #216 | Tragic 54.1% |
| Immigrants | Burma/Myanmar | 7.1 /100 | #217 | Tragic 53.9% |
| Immigrants | Argentina | 6.8 /100 | #218 | Tragic 53.9% |