Hmong vs Immigrants from Hungary 2 or more Vehicles in Household
COMPARE
Hmong
Immigrants from Hungary
2 or more Vehicles in Household
2 or more Vehicles in Household Comparison
Hmong
Immigrants from Hungary
57.8%
2 OR MORE VEHICLES IN HOUSEHOLD
98.9/ 100
METRIC RATING
95th/ 347
METRIC RANK
54.2%
2 OR MORE VEHICLES IN HOUSEHOLD
11.3/ 100
METRIC RATING
211th/ 347
METRIC RANK
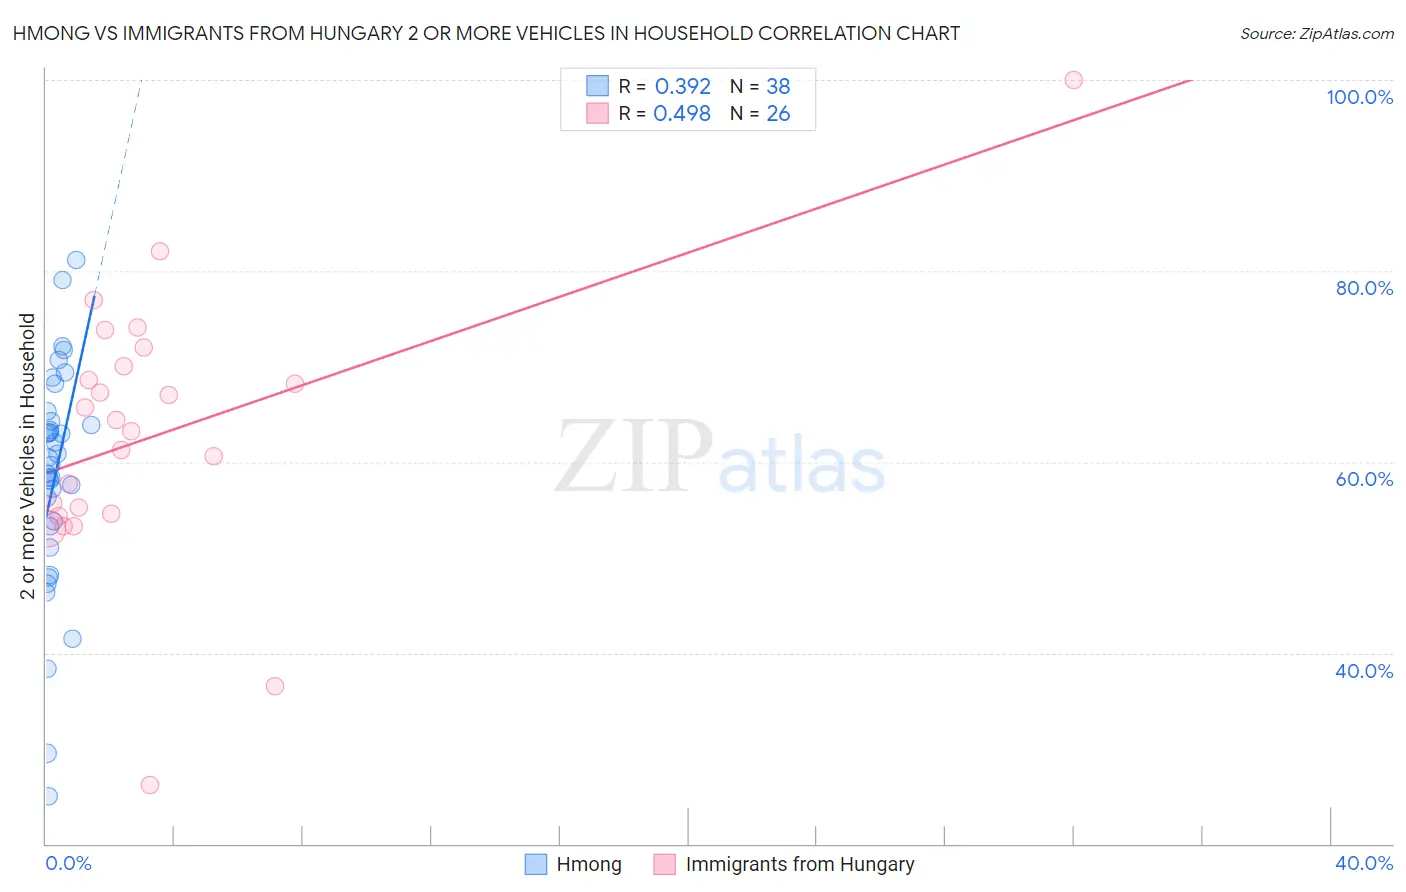
Hmong vs Immigrants from Hungary 2 or more Vehicles in Household Correlation Chart
The statistical analysis conducted on geographies consisting of 24,669,739 people shows a mild positive correlation between the proportion of Hmong and percentage of households with 2 or more vehicles available in the United States with a correlation coefficient (R) of 0.392 and weighted average of 57.8%. Similarly, the statistical analysis conducted on geographies consisting of 195,676,046 people shows a moderate positive correlation between the proportion of Immigrants from Hungary and percentage of households with 2 or more vehicles available in the United States with a correlation coefficient (R) of 0.498 and weighted average of 54.2%, a difference of 6.6%.
2 or more Vehicles in Household Correlation Summary
| Measurement | Hmong | Immigrants from Hungary |
| Minimum | 25.0% | 26.2% |
| Maximum | 81.2% | 100.0% |
| Range | 56.2% | 73.8% |
| Mean | 58.4% | 62.9% |
| Median | 60.0% | 63.8% |
| Interquartile 25% (IQ1) | 53.3% | 54.5% |
| Interquartile 75% (IQ3) | 64.2% | 70.1% |
| Interquartile Range (IQR) | 10.9% | 15.6% |
| Standard Deviation (Sample) | 11.9% | 14.2% |
| Standard Deviation (Population) | 11.8% | 13.9% |
Similar Demographics by 2 or more Vehicles in Household
Demographics Similar to Hmong by 2 or more Vehicles in Household
In terms of 2 or more vehicles in household, the demographic groups most similar to Hmong are Filipino (57.8%, a difference of 0.020%), Burmese (57.8%, a difference of 0.030%), Slavic (57.8%, a difference of 0.060%), Ottawa (57.9%, a difference of 0.080%), and Shoshone (57.9%, a difference of 0.090%).
| Demographics | Rating | Rank | 2 or more Vehicles in Household |
| Immigrants | Iran | 99.1 /100 | #88 | Exceptional 57.9% |
| Immigrants | Germany | 99.0 /100 | #89 | Exceptional 57.9% |
| Hispanics or Latinos | 99.0 /100 | #90 | Exceptional 57.9% |
| Pakistanis | 99.0 /100 | #91 | Exceptional 57.9% |
| Shoshone | 99.0 /100 | #92 | Exceptional 57.9% |
| Ottawa | 99.0 /100 | #93 | Exceptional 57.9% |
| Filipinos | 98.9 /100 | #94 | Exceptional 57.8% |
| Hmong | 98.9 /100 | #95 | Exceptional 57.8% |
| Burmese | 98.8 /100 | #96 | Exceptional 57.8% |
| Slavs | 98.8 /100 | #97 | Exceptional 57.8% |
| Palestinians | 98.6 /100 | #98 | Exceptional 57.7% |
| Cajuns | 98.5 /100 | #99 | Exceptional 57.7% |
| Fijians | 98.4 /100 | #100 | Exceptional 57.6% |
| Lebanese | 98.3 /100 | #101 | Exceptional 57.6% |
| Immigrants | Bolivia | 98.2 /100 | #102 | Exceptional 57.6% |
Demographics Similar to Immigrants from Hungary by 2 or more Vehicles in Household
In terms of 2 or more vehicles in household, the demographic groups most similar to Immigrants from Hungary are Immigrants from Saudi Arabia (54.2%, a difference of 0.010%), Immigrants from Chile (54.2%, a difference of 0.020%), Egyptian (54.3%, a difference of 0.070%), Immigrants from Bulgaria (54.3%, a difference of 0.070%), and Turkish (54.3%, a difference of 0.16%).
| Demographics | Rating | Rank | 2 or more Vehicles in Household |
| Immigrants | Belgium | 13.7 /100 | #204 | Poor 54.3% |
| Cheyenne | 13.6 /100 | #205 | Poor 54.3% |
| Immigrants | Latin America | 13.1 /100 | #206 | Poor 54.3% |
| Turks | 13.0 /100 | #207 | Poor 54.3% |
| Egyptians | 12.0 /100 | #208 | Poor 54.3% |
| Immigrants | Bulgaria | 12.0 /100 | #209 | Poor 54.3% |
| Immigrants | Saudi Arabia | 11.3 /100 | #210 | Poor 54.2% |
| Immigrants | Hungary | 11.3 /100 | #211 | Poor 54.2% |
| Immigrants | Chile | 11.1 /100 | #212 | Poor 54.2% |
| Guatemalans | 9.6 /100 | #213 | Tragic 54.1% |
| Immigrants | Czechoslovakia | 9.4 /100 | #214 | Tragic 54.1% |
| Aleuts | 9.3 /100 | #215 | Tragic 54.1% |
| Immigrants | Western Asia | 9.3 /100 | #216 | Tragic 54.1% |
| Immigrants | Burma/Myanmar | 7.1 /100 | #217 | Tragic 53.9% |
| Immigrants | Argentina | 6.8 /100 | #218 | Tragic 53.9% |