Immigrants from England vs Greek Female Poverty Among 25-34 Year Olds
COMPARE
Immigrants from England
Greek
Female Poverty Among 25-34 Year Olds
Female Poverty Among 25-34 Year Olds Comparison
Immigrants from England
Greeks
13.0%
FEMALE POVERTY AMONG 25-34 YEAR OLDS
85.5/ 100
METRIC RATING
136th/ 347
METRIC RANK
12.3%
FEMALE POVERTY AMONG 25-34 YEAR OLDS
98.9/ 100
METRIC RATING
76th/ 347
METRIC RANK
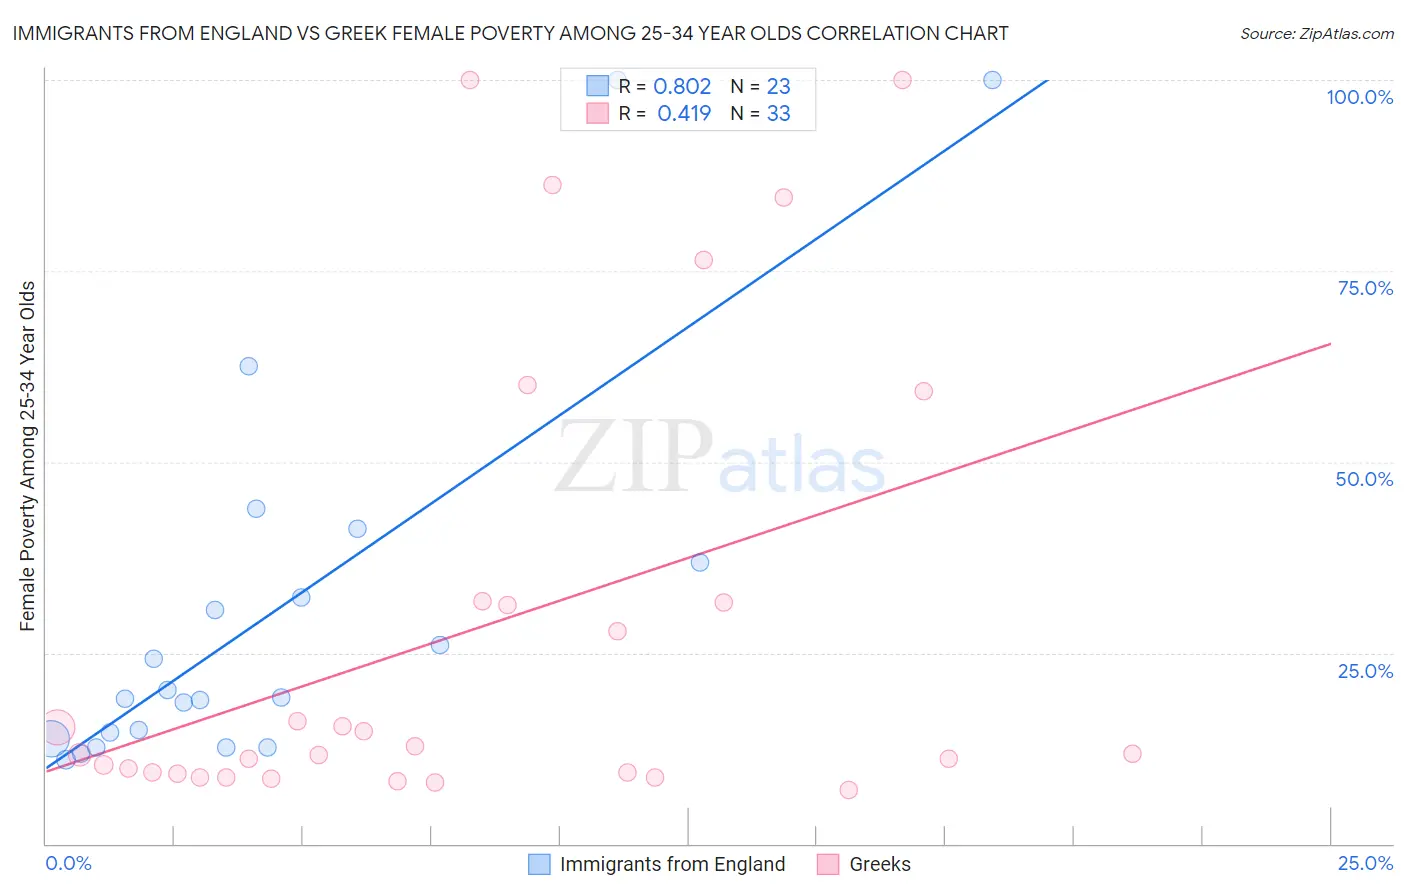
Immigrants from England vs Greek Female Poverty Among 25-34 Year Olds Correlation Chart
The statistical analysis conducted on geographies consisting of 384,281,453 people shows a very strong positive correlation between the proportion of Immigrants from England and poverty level among females between the ages 25 and 34 in the United States with a correlation coefficient (R) of 0.802 and weighted average of 13.0%. Similarly, the statistical analysis conducted on geographies consisting of 470,128,205 people shows a moderate positive correlation between the proportion of Greeks and poverty level among females between the ages 25 and 34 in the United States with a correlation coefficient (R) of 0.419 and weighted average of 12.3%, a difference of 6.1%.
Female Poverty Among 25-34 Year Olds Correlation Summary
| Measurement | Immigrants from England | Greek |
| Minimum | 11.0% | 7.0% |
| Maximum | 100.0% | 100.0% |
| Range | 89.0% | 93.0% |
| Mean | 30.3% | 28.1% |
| Median | 19.1% | 11.8% |
| Interquartile 25% (IQ1) | 13.7% | 9.2% |
| Interquartile 75% (IQ3) | 36.8% | 31.6% |
| Interquartile Range (IQR) | 23.1% | 22.4% |
| Standard Deviation (Sample) | 25.4% | 29.6% |
| Standard Deviation (Population) | 24.8% | 29.1% |
Similar Demographics by Female Poverty Among 25-34 Year Olds
Demographics Similar to Immigrants from England by Female Poverty Among 25-34 Year Olds
In terms of female poverty among 25-34 year olds, the demographic groups most similar to Immigrants from England are South African (13.0%, a difference of 0.020%), Afghan (13.0%, a difference of 0.040%), Immigrants from Chile (13.1%, a difference of 0.16%), Brazilian (13.1%, a difference of 0.17%), and Austrian (13.1%, a difference of 0.30%).
| Demographics | Rating | Rank | Female Poverty Among 25-34 Year Olds |
| Immigrants | North America | 89.7 /100 | #129 | Excellent 12.9% |
| Immigrants | Uzbekistan | 89.6 /100 | #130 | Excellent 12.9% |
| Pakistanis | 88.4 /100 | #131 | Excellent 13.0% |
| Immigrants | Hungary | 88.3 /100 | #132 | Excellent 13.0% |
| Serbians | 87.6 /100 | #133 | Excellent 13.0% |
| Afghans | 85.8 /100 | #134 | Excellent 13.0% |
| South Africans | 85.7 /100 | #135 | Excellent 13.0% |
| Immigrants | England | 85.5 /100 | #136 | Excellent 13.0% |
| Immigrants | Chile | 84.6 /100 | #137 | Excellent 13.1% |
| Brazilians | 84.5 /100 | #138 | Excellent 13.1% |
| Austrians | 83.7 /100 | #139 | Excellent 13.1% |
| Immigrants | Iraq | 83.6 /100 | #140 | Excellent 13.1% |
| New Zealanders | 83.4 /100 | #141 | Excellent 13.1% |
| Scandinavians | 82.3 /100 | #142 | Excellent 13.1% |
| Israelis | 81.9 /100 | #143 | Excellent 13.1% |
Demographics Similar to Greeks by Female Poverty Among 25-34 Year Olds
In terms of female poverty among 25-34 year olds, the demographic groups most similar to Greeks are Estonian (12.3%, a difference of 0.060%), Immigrants from Sweden (12.3%, a difference of 0.11%), Immigrants from Vietnam (12.3%, a difference of 0.14%), Immigrants from Italy (12.3%, a difference of 0.16%), and Immigrants from Ukraine (12.3%, a difference of 0.39%).
| Demographics | Rating | Rank | Female Poverty Among 25-34 Year Olds |
| Immigrants | Lebanon | 99.1 /100 | #69 | Exceptional 12.2% |
| Immigrants | Belgium | 99.1 /100 | #70 | Exceptional 12.2% |
| Immigrants | Scotland | 99.1 /100 | #71 | Exceptional 12.2% |
| Lithuanians | 99.1 /100 | #72 | Exceptional 12.2% |
| Immigrants | Vietnam | 98.9 /100 | #73 | Exceptional 12.3% |
| Immigrants | Sweden | 98.9 /100 | #74 | Exceptional 12.3% |
| Estonians | 98.9 /100 | #75 | Exceptional 12.3% |
| Greeks | 98.9 /100 | #76 | Exceptional 12.3% |
| Immigrants | Italy | 98.8 /100 | #77 | Exceptional 12.3% |
| Immigrants | Ukraine | 98.6 /100 | #78 | Exceptional 12.3% |
| Immigrants | Jordan | 98.5 /100 | #79 | Exceptional 12.4% |
| Immigrants | Malaysia | 98.3 /100 | #80 | Exceptional 12.4% |
| Immigrants | Kazakhstan | 98.1 /100 | #81 | Exceptional 12.4% |
| Ethiopians | 98.0 /100 | #82 | Exceptional 12.4% |
| Albanians | 97.7 /100 | #83 | Exceptional 12.5% |