Immigrants from England vs Greek Male Disability
COMPARE
Immigrants from England
Greek
Male Disability
Male Disability Comparison
Immigrants from England
Greeks
11.7%
MALE DISABILITY
4.0/ 100
METRIC RATING
218th/ 347
METRIC RANK
11.4%
MALE DISABILITY
22.2/ 100
METRIC RATING
193rd/ 347
METRIC RANK
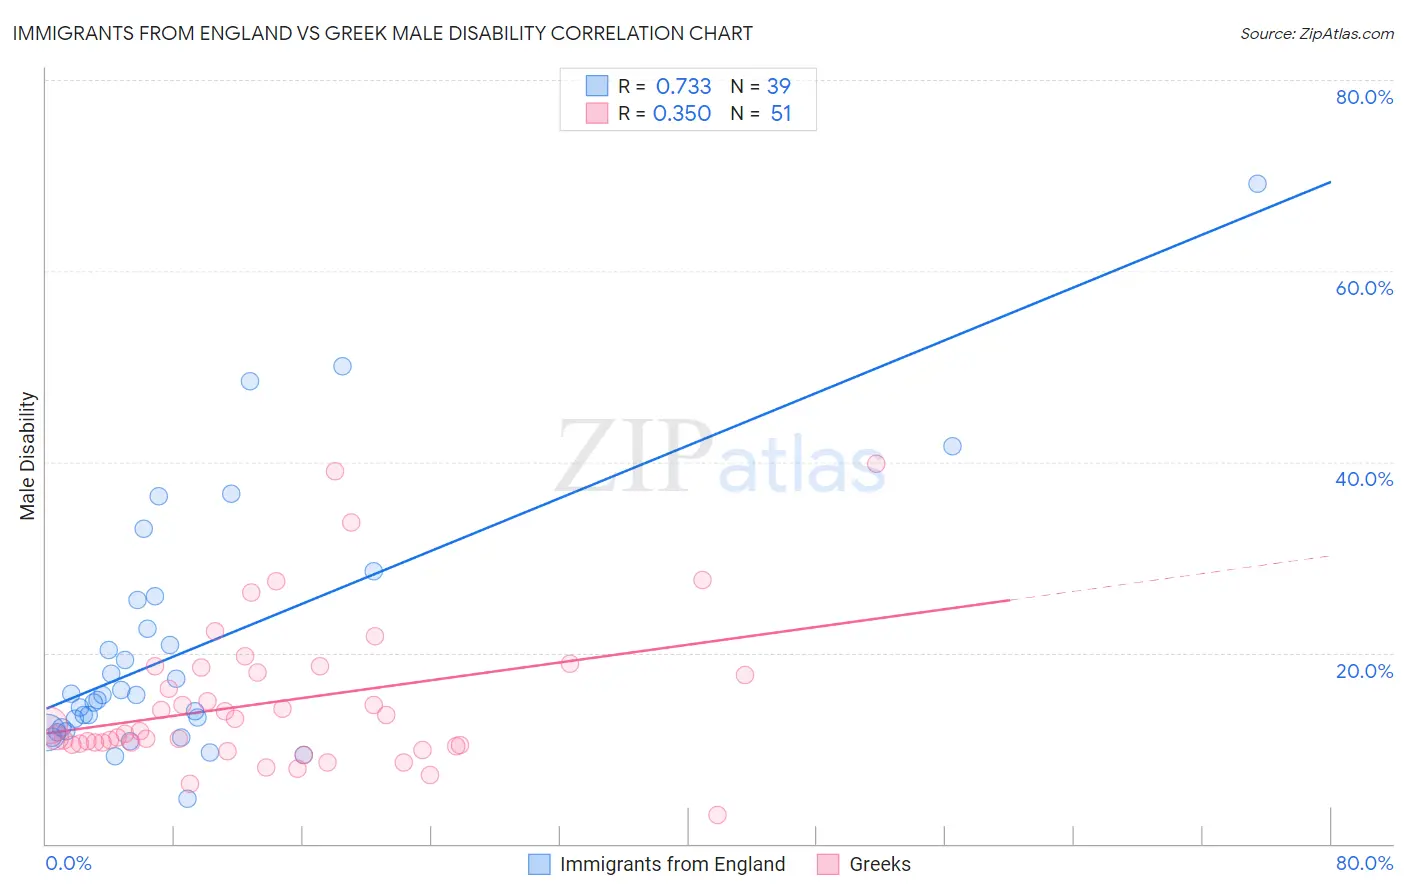
Immigrants from England vs Greek Male Disability Correlation Chart
The statistical analysis conducted on geographies consisting of 391,879,882 people shows a strong positive correlation between the proportion of Immigrants from England and percentage of males with a disability in the United States with a correlation coefficient (R) of 0.733 and weighted average of 11.7%. Similarly, the statistical analysis conducted on geographies consisting of 482,664,692 people shows a mild positive correlation between the proportion of Greeks and percentage of males with a disability in the United States with a correlation coefficient (R) of 0.350 and weighted average of 11.4%, a difference of 2.6%.
Male Disability Correlation Summary
| Measurement | Immigrants from England | Greek |
| Minimum | 4.7% | 3.0% |
| Maximum | 69.2% | 39.7% |
| Range | 64.4% | 36.7% |
| Mean | 20.5% | 14.9% |
| Median | 15.5% | 11.8% |
| Interquartile 25% (IQ1) | 11.8% | 10.4% |
| Interquartile 75% (IQ3) | 25.5% | 18.5% |
| Interquartile Range (IQR) | 13.6% | 8.1% |
| Standard Deviation (Sample) | 13.5% | 7.8% |
| Standard Deviation (Population) | 13.3% | 7.7% |
Similar Demographics by Male Disability
Demographics Similar to Immigrants from England by Male Disability
In terms of male disability, the demographic groups most similar to Immigrants from England are Panamanian (11.7%, a difference of 0.060%), Immigrants from Western Europe (11.7%, a difference of 0.070%), Immigrants from Congo (11.7%, a difference of 0.080%), Immigrants from Dominica (11.7%, a difference of 0.21%), and Alsatian (11.7%, a difference of 0.23%).
| Demographics | Rating | Rank | Male Disability |
| Immigrants | Thailand | 8.4 /100 | #211 | Tragic 11.6% |
| Immigrants | Scotland | 8.2 /100 | #212 | Tragic 11.6% |
| Mexican American Indians | 7.8 /100 | #213 | Tragic 11.6% |
| Lithuanians | 6.6 /100 | #214 | Tragic 11.6% |
| Indonesians | 5.9 /100 | #215 | Tragic 11.6% |
| Immigrants | Dominican Republic | 4.9 /100 | #216 | Tragic 11.7% |
| Immigrants | Dominica | 4.6 /100 | #217 | Tragic 11.7% |
| Immigrants | England | 4.0 /100 | #218 | Tragic 11.7% |
| Panamanians | 3.8 /100 | #219 | Tragic 11.7% |
| Immigrants | Western Europe | 3.8 /100 | #220 | Tragic 11.7% |
| Immigrants | Congo | 3.7 /100 | #221 | Tragic 11.7% |
| Alsatians | 3.3 /100 | #222 | Tragic 11.7% |
| Immigrants | Bahamas | 3.2 /100 | #223 | Tragic 11.7% |
| Japanese | 3.1 /100 | #224 | Tragic 11.7% |
| Liberians | 3.1 /100 | #225 | Tragic 11.8% |
Demographics Similar to Greeks by Male Disability
In terms of male disability, the demographic groups most similar to Greeks are Assyrian/Chaldean/Syriac (11.4%, a difference of 0.070%), Senegalese (11.4%, a difference of 0.080%), Belizean (11.4%, a difference of 0.080%), Immigrants from Oceania (11.4%, a difference of 0.11%), and Immigrants from Bosnia and Herzegovina (11.4%, a difference of 0.24%).
| Demographics | Rating | Rank | Male Disability |
| Immigrants | Zaire | 27.6 /100 | #186 | Fair 11.4% |
| Immigrants | Austria | 27.3 /100 | #187 | Fair 11.4% |
| Estonians | 26.8 /100 | #188 | Fair 11.4% |
| Immigrants | Netherlands | 25.9 /100 | #189 | Fair 11.4% |
| Immigrants | Bosnia and Herzegovina | 25.4 /100 | #190 | Fair 11.4% |
| Senegalese | 23.2 /100 | #191 | Fair 11.4% |
| Assyrians/Chaldeans/Syriacs | 23.2 /100 | #192 | Fair 11.4% |
| Greeks | 22.2 /100 | #193 | Fair 11.4% |
| Belizeans | 21.2 /100 | #194 | Fair 11.4% |
| Immigrants | Oceania | 20.9 /100 | #195 | Fair 11.4% |
| West Indians | 18.4 /100 | #196 | Poor 11.4% |
| Somalis | 18.2 /100 | #197 | Poor 11.4% |
| Immigrants | Jamaica | 16.3 /100 | #198 | Poor 11.5% |
| Lebanese | 15.4 /100 | #199 | Poor 11.5% |
| Immigrants | Iraq | 13.0 /100 | #200 | Poor 11.5% |