Immigrants from Eastern Europe vs Cree 9th Grade
COMPARE
Immigrants from Eastern Europe
Cree
9th Grade
9th Grade Comparison
Immigrants from Eastern Europe
Cree
95.2%
9TH GRADE
85.8/ 100
METRIC RATING
139th/ 347
METRIC RANK
95.4%
9TH GRADE
95.5/ 100
METRIC RATING
121st/ 347
METRIC RANK
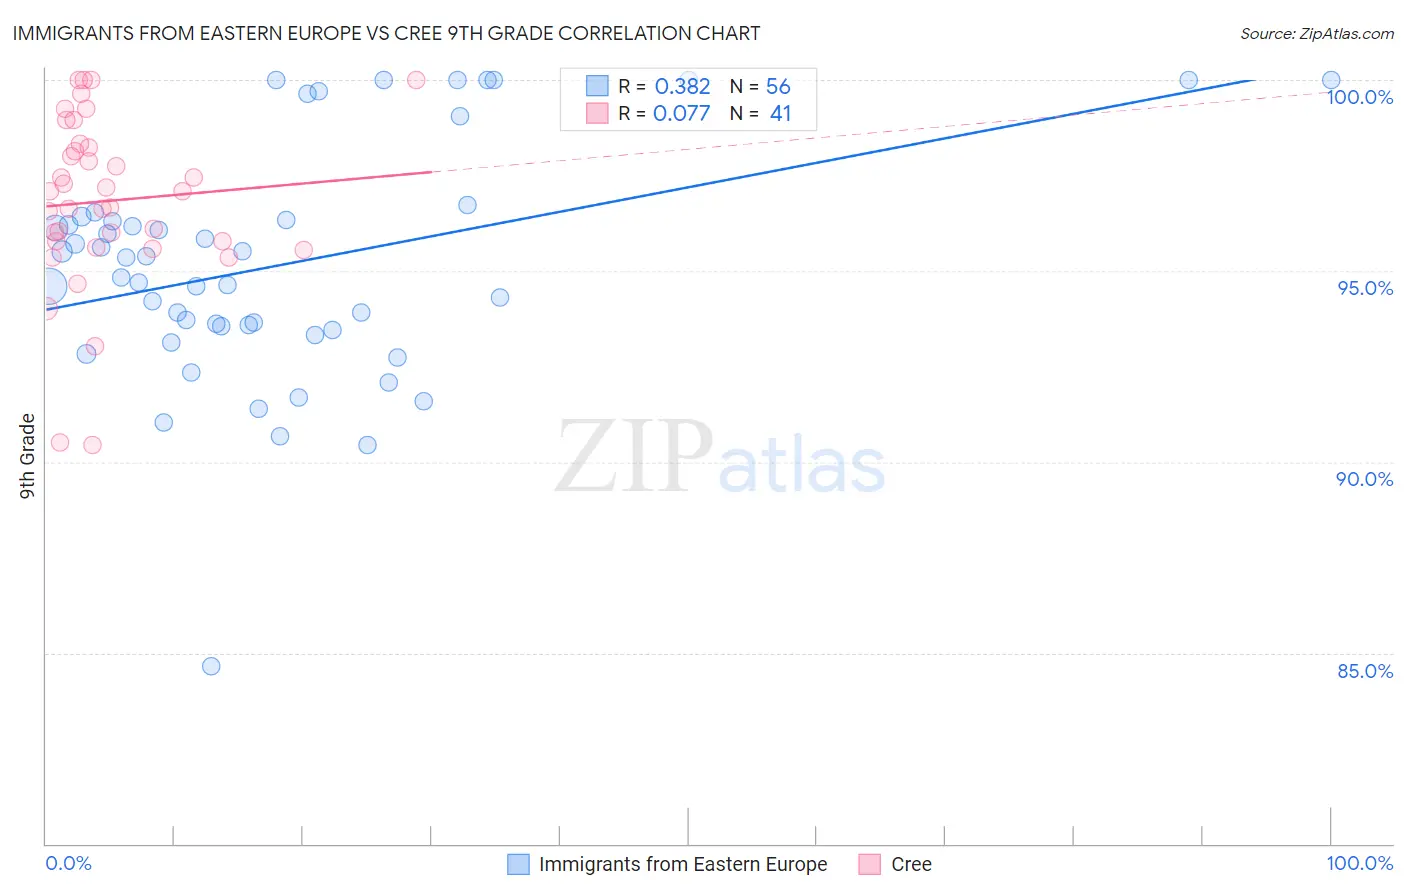
Immigrants from Eastern Europe vs Cree 9th Grade Correlation Chart
The statistical analysis conducted on geographies consisting of 475,879,420 people shows a mild positive correlation between the proportion of Immigrants from Eastern Europe and percentage of population with at least 9th grade education in the United States with a correlation coefficient (R) of 0.382 and weighted average of 95.2%. Similarly, the statistical analysis conducted on geographies consisting of 76,211,744 people shows a slight positive correlation between the proportion of Cree and percentage of population with at least 9th grade education in the United States with a correlation coefficient (R) of 0.077 and weighted average of 95.4%, a difference of 0.23%.
9th Grade Correlation Summary
| Measurement | Immigrants from Eastern Europe | Cree |
| Minimum | 84.6% | 90.4% |
| Maximum | 100.0% | 100.0% |
| Range | 15.4% | 9.6% |
| Mean | 95.2% | 96.8% |
| Median | 95.1% | 97.1% |
| Interquartile 25% (IQ1) | 93.5% | 95.7% |
| Interquartile 75% (IQ3) | 96.4% | 98.3% |
| Interquartile Range (IQR) | 2.9% | 2.6% |
| Standard Deviation (Sample) | 3.1% | 2.2% |
| Standard Deviation (Population) | 3.1% | 2.2% |
Demographics Similar to Immigrants from Eastern Europe and Cree by 9th Grade
In terms of 9th grade, the demographic groups most similar to Immigrants from Eastern Europe are Immigrants from Russia (95.2%, a difference of 0.010%), Immigrants from Taiwan (95.2%, a difference of 0.010%), Hmong (95.2%, a difference of 0.030%), Immigrants from Iran (95.2%, a difference of 0.040%), and Immigrants from Belarus (95.2%, a difference of 0.050%). Similarly, the demographic groups most similar to Cree are Cambodian (95.4%, a difference of 0.0%), Immigrants from Kuwait (95.4%, a difference of 0.0%), Kiowa (95.4%, a difference of 0.010%), Shoshone (95.4%, a difference of 0.010%), and Immigrants from South Central Asia (95.4%, a difference of 0.020%).
| Demographics | Rating | Rank | 9th Grade |
| Cambodians | 95.6 /100 | #120 | Exceptional 95.4% |
| Cree | 95.5 /100 | #121 | Exceptional 95.4% |
| Immigrants | Kuwait | 95.5 /100 | #122 | Exceptional 95.4% |
| Kiowa | 95.3 /100 | #123 | Exceptional 95.4% |
| Shoshone | 95.3 /100 | #124 | Exceptional 95.4% |
| Immigrants | South Central Asia | 95.1 /100 | #125 | Exceptional 95.4% |
| Immigrants | Serbia | 94.4 /100 | #126 | Exceptional 95.4% |
| Palestinians | 94.3 /100 | #127 | Exceptional 95.4% |
| Immigrants | Hungary | 94.2 /100 | #128 | Exceptional 95.4% |
| Basques | 94.1 /100 | #129 | Exceptional 95.4% |
| Jordanians | 93.5 /100 | #130 | Exceptional 95.3% |
| Immigrants | North Macedonia | 92.3 /100 | #131 | Exceptional 95.3% |
| Immigrants | Nonimmigrants | 92.0 /100 | #132 | Exceptional 95.3% |
| Israelis | 90.4 /100 | #133 | Exceptional 95.3% |
| Immigrants | Israel | 89.6 /100 | #134 | Excellent 95.3% |
| Immigrants | Belarus | 88.9 /100 | #135 | Excellent 95.2% |
| Immigrants | Iran | 88.3 /100 | #136 | Excellent 95.2% |
| Hmong | 87.7 /100 | #137 | Excellent 95.2% |
| Immigrants | Russia | 86.6 /100 | #138 | Excellent 95.2% |
| Immigrants | Eastern Europe | 85.8 /100 | #139 | Excellent 95.2% |
| Immigrants | Taiwan | 85.3 /100 | #140 | Excellent 95.2% |