Immigrants from Eastern Europe vs Chippewa 3 or more Vehicles in Household
COMPARE
Immigrants from Eastern Europe
Chippewa
3 or more Vehicles in Household
3 or more Vehicles in Household Comparison
Immigrants from Eastern Europe
Chippewa
17.4%
3 OR MORE VEHICLES IN HOUSEHOLD
0.3/ 100
METRIC RATING
280th/ 347
METRIC RANK
21.5%
3 OR MORE VEHICLES IN HOUSEHOLD
99.6/ 100
METRIC RATING
83rd/ 347
METRIC RANK
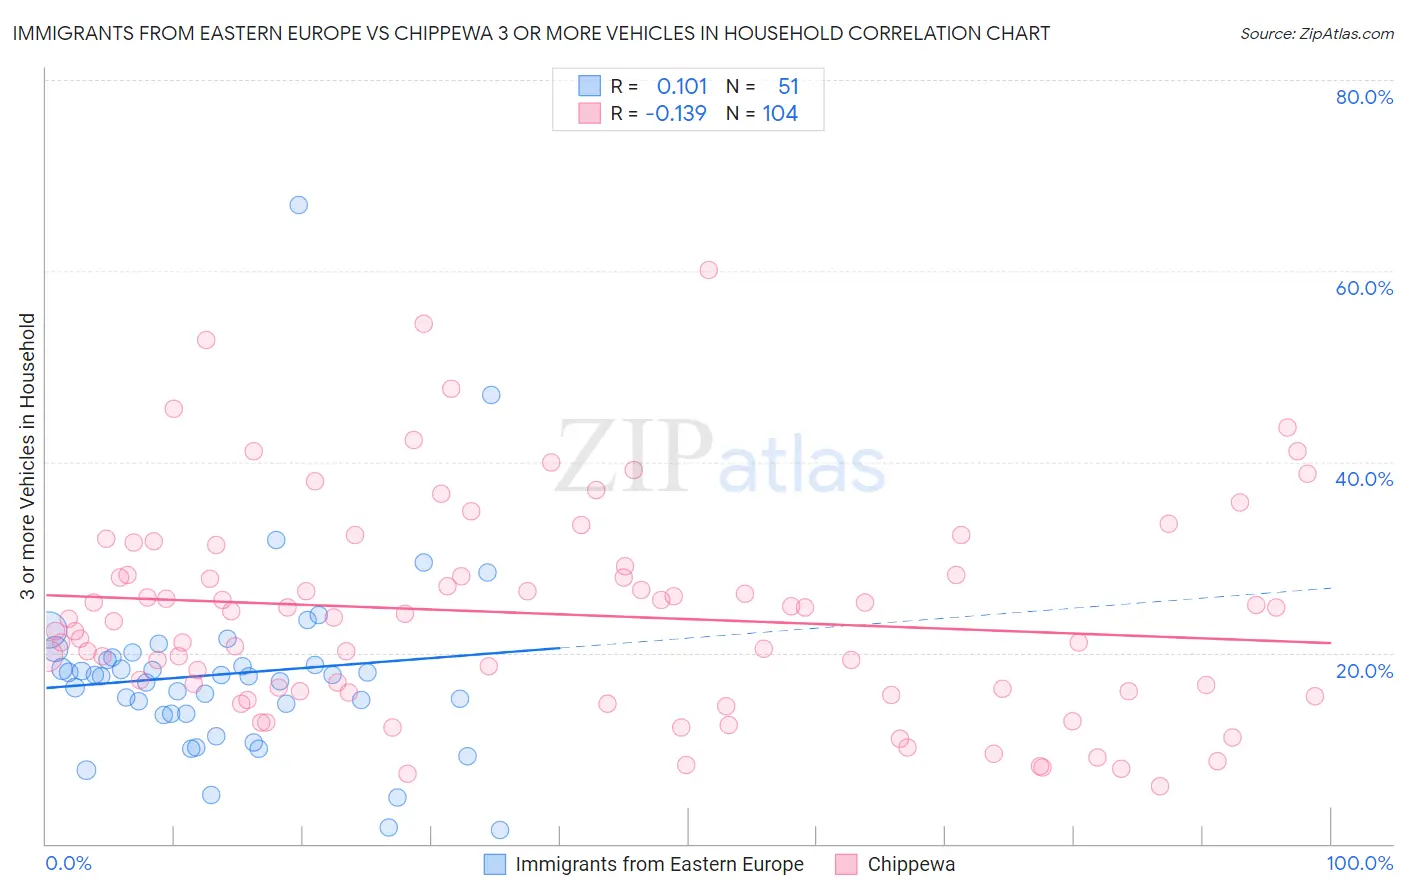
Immigrants from Eastern Europe vs Chippewa 3 or more Vehicles in Household Correlation Chart
The statistical analysis conducted on geographies consisting of 475,306,541 people shows a poor positive correlation between the proportion of Immigrants from Eastern Europe and percentage of households with 3 or more vehicles available in the United States with a correlation coefficient (R) of 0.101 and weighted average of 17.4%. Similarly, the statistical analysis conducted on geographies consisting of 214,974,955 people shows a poor negative correlation between the proportion of Chippewa and percentage of households with 3 or more vehicles available in the United States with a correlation coefficient (R) of -0.139 and weighted average of 21.5%, a difference of 23.7%.
3 or more Vehicles in Household Correlation Summary
| Measurement | Immigrants from Eastern Europe | Chippewa |
| Minimum | 1.4% | 6.0% |
| Maximum | 66.9% | 60.1% |
| Range | 65.5% | 54.1% |
| Mean | 17.8% | 24.1% |
| Median | 17.6% | 23.7% |
| Interquartile 25% (IQ1) | 13.6% | 15.9% |
| Interquartile 75% (IQ3) | 19.5% | 28.6% |
| Interquartile Range (IQR) | 5.9% | 12.7% |
| Standard Deviation (Sample) | 10.3% | 11.0% |
| Standard Deviation (Population) | 10.2% | 11.0% |
Similar Demographics by 3 or more Vehicles in Household
Demographics Similar to Immigrants from Eastern Europe by 3 or more Vehicles in Household
In terms of 3 or more vehicles in household, the demographic groups most similar to Immigrants from Eastern Europe are Immigrants from Kazakhstan (17.4%, a difference of 0.040%), Immigrants from Latvia (17.4%, a difference of 0.040%), Immigrants from Bahamas (17.4%, a difference of 0.050%), Brazilian (17.4%, a difference of 0.14%), and Okinawan (17.4%, a difference of 0.29%).
| Demographics | Rating | Rank | 3 or more Vehicles in Household |
| Immigrants | Sudan | 0.5 /100 | #273 | Tragic 17.6% |
| Immigrants | Bosnia and Herzegovina | 0.5 /100 | #274 | Tragic 17.5% |
| Immigrants | Ukraine | 0.4 /100 | #275 | Tragic 17.5% |
| Okinawans | 0.4 /100 | #276 | Tragic 17.4% |
| Brazilians | 0.4 /100 | #277 | Tragic 17.4% |
| Immigrants | Bahamas | 0.3 /100 | #278 | Tragic 17.4% |
| Immigrants | Kazakhstan | 0.3 /100 | #279 | Tragic 17.4% |
| Immigrants | Eastern Europe | 0.3 /100 | #280 | Tragic 17.4% |
| Immigrants | Latvia | 0.3 /100 | #281 | Tragic 17.4% |
| Immigrants | Ireland | 0.3 /100 | #282 | Tragic 17.3% |
| Blacks/African Americans | 0.3 /100 | #283 | Tragic 17.3% |
| Immigrants | Colombia | 0.3 /100 | #284 | Tragic 17.3% |
| Immigrants | Croatia | 0.2 /100 | #285 | Tragic 17.2% |
| Menominee | 0.2 /100 | #286 | Tragic 17.2% |
| Immigrants | Brazil | 0.2 /100 | #287 | Tragic 17.1% |
Demographics Similar to Chippewa by 3 or more Vehicles in Household
In terms of 3 or more vehicles in household, the demographic groups most similar to Chippewa are Immigrants from El Salvador (21.5%, a difference of 0.030%), Icelander (21.5%, a difference of 0.050%), Laotian (21.5%, a difference of 0.070%), Delaware (21.5%, a difference of 0.14%), and Immigrants from the Azores (21.5%, a difference of 0.26%).
| Demographics | Rating | Rank | 3 or more Vehicles in Household |
| Immigrants | Nonimmigrants | 99.8 /100 | #76 | Exceptional 21.8% |
| Irish | 99.8 /100 | #77 | Exceptional 21.8% |
| Czechoslovakians | 99.8 /100 | #78 | Exceptional 21.7% |
| Assyrians/Chaldeans/Syriacs | 99.8 /100 | #79 | Exceptional 21.7% |
| Afghans | 99.7 /100 | #80 | Exceptional 21.7% |
| Celtics | 99.7 /100 | #81 | Exceptional 21.7% |
| Immigrants | El Salvador | 99.6 /100 | #82 | Exceptional 21.5% |
| Chippewa | 99.6 /100 | #83 | Exceptional 21.5% |
| Icelanders | 99.6 /100 | #84 | Exceptional 21.5% |
| Laotians | 99.6 /100 | #85 | Exceptional 21.5% |
| Delaware | 99.6 /100 | #86 | Exceptional 21.5% |
| Immigrants | Azores | 99.5 /100 | #87 | Exceptional 21.5% |
| French | 99.4 /100 | #88 | Exceptional 21.4% |
| Marshallese | 99.2 /100 | #89 | Exceptional 21.3% |
| Immigrants | Afghanistan | 99.1 /100 | #90 | Exceptional 21.2% |