Immigrants from Eastern Asia vs Zimbabwean 2 or more Vehicles in Household
COMPARE
Immigrants from Eastern Asia
Zimbabwean
2 or more Vehicles in Household
2 or more Vehicles in Household Comparison
Immigrants from Eastern Asia
Zimbabweans
53.2%
2 OR MORE VEHICLES IN HOUSEHOLD
2.1/ 100
METRIC RATING
242nd/ 347
METRIC RANK
57.2%
2 OR MORE VEHICLES IN HOUSEHOLD
96.9/ 100
METRIC RATING
113th/ 347
METRIC RANK
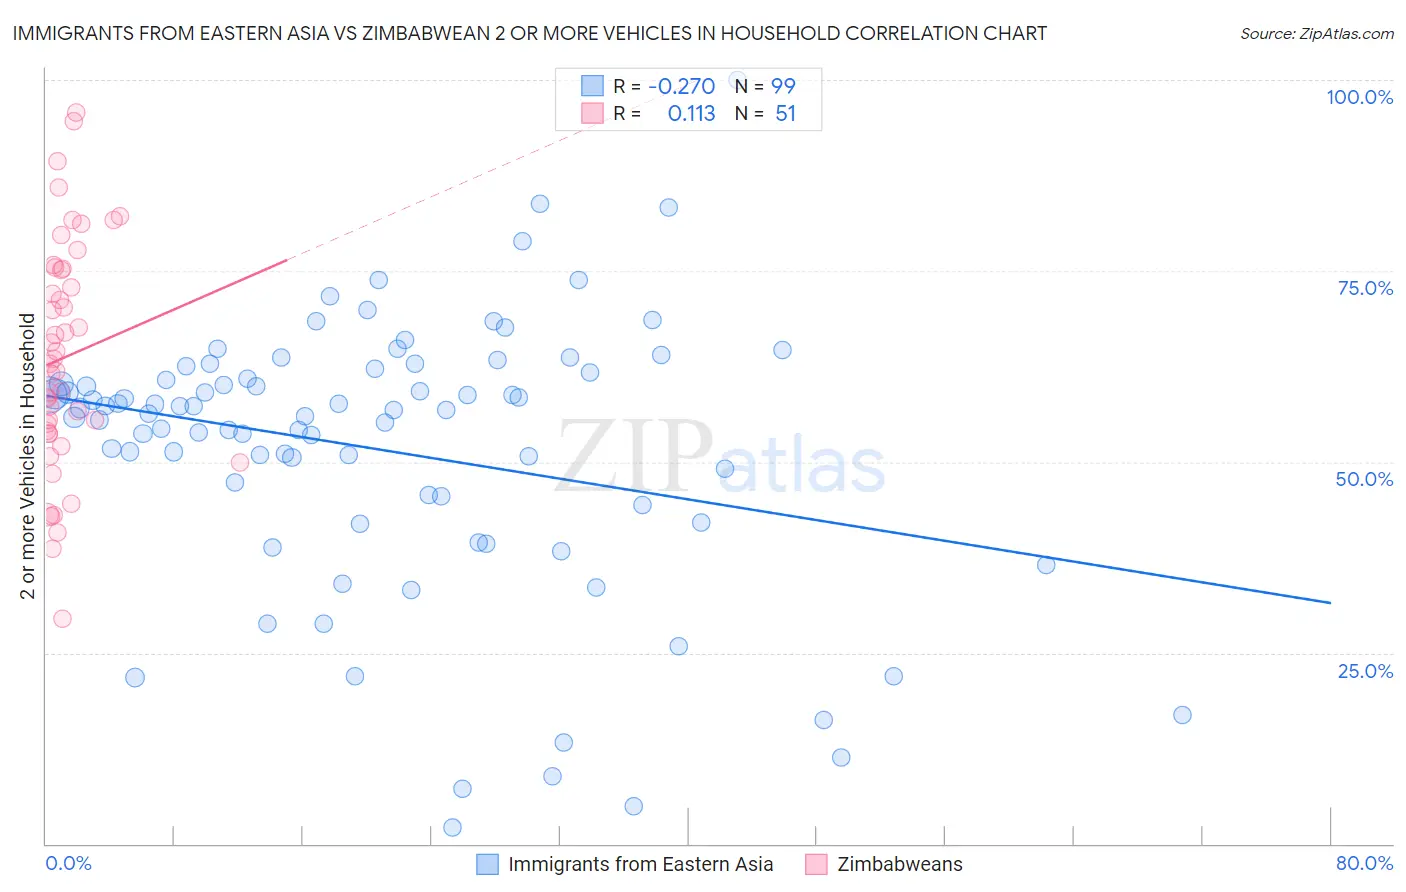
Immigrants from Eastern Asia vs Zimbabwean 2 or more Vehicles in Household Correlation Chart
The statistical analysis conducted on geographies consisting of 499,455,795 people shows a weak negative correlation between the proportion of Immigrants from Eastern Asia and percentage of households with 2 or more vehicles available in the United States with a correlation coefficient (R) of -0.270 and weighted average of 53.2%. Similarly, the statistical analysis conducted on geographies consisting of 69,192,017 people shows a poor positive correlation between the proportion of Zimbabweans and percentage of households with 2 or more vehicles available in the United States with a correlation coefficient (R) of 0.113 and weighted average of 57.2%, a difference of 7.5%.
2 or more Vehicles in Household Correlation Summary
| Measurement | Immigrants from Eastern Asia | Zimbabwean |
| Minimum | 2.1% | 29.5% |
| Maximum | 100.0% | 95.8% |
| Range | 97.9% | 66.3% |
| Mean | 51.5% | 63.7% |
| Median | 56.8% | 62.9% |
| Interquartile 25% (IQ1) | 44.3% | 53.7% |
| Interquartile 75% (IQ3) | 61.7% | 75.3% |
| Interquartile Range (IQR) | 17.4% | 21.6% |
| Standard Deviation (Sample) | 18.0% | 14.9% |
| Standard Deviation (Population) | 17.9% | 14.8% |
Similar Demographics by 2 or more Vehicles in Household
Demographics Similar to Immigrants from Eastern Asia by 2 or more Vehicles in Household
In terms of 2 or more vehicles in household, the demographic groups most similar to Immigrants from Eastern Asia are Immigrants from Sierra Leone (53.2%, a difference of 0.0%), Immigrants from Europe (53.2%, a difference of 0.030%), Cambodian (53.3%, a difference of 0.10%), Immigrants from Armenia (53.3%, a difference of 0.11%), and Macedonian (53.3%, a difference of 0.17%).
| Demographics | Rating | Rank | 2 or more Vehicles in Household |
| Immigrants | Middle Africa | 3.0 /100 | #235 | Tragic 53.4% |
| Indonesians | 2.7 /100 | #236 | Tragic 53.4% |
| Macedonians | 2.4 /100 | #237 | Tragic 53.3% |
| Immigrants | Armenia | 2.3 /100 | #238 | Tragic 53.3% |
| Cambodians | 2.3 /100 | #239 | Tragic 53.3% |
| Immigrants | Europe | 2.1 /100 | #240 | Tragic 53.2% |
| Immigrants | Sierra Leone | 2.1 /100 | #241 | Tragic 53.2% |
| Immigrants | Eastern Asia | 2.1 /100 | #242 | Tragic 53.2% |
| Ethiopians | 1.7 /100 | #243 | Tragic 53.1% |
| Indians (Asian) | 1.7 /100 | #244 | Tragic 53.1% |
| Immigrants | Ethiopia | 1.5 /100 | #245 | Tragic 53.0% |
| Immigrants | Nigeria | 1.2 /100 | #246 | Tragic 52.9% |
| Sierra Leoneans | 1.2 /100 | #247 | Tragic 52.9% |
| Colombians | 1.1 /100 | #248 | Tragic 52.9% |
| Immigrants | Brazil | 1.0 /100 | #249 | Tragic 52.8% |
Demographics Similar to Zimbabweans by 2 or more Vehicles in Household
In terms of 2 or more vehicles in household, the demographic groups most similar to Zimbabweans are Immigrants from Lebanon (57.2%, a difference of 0.030%), Chippewa (57.2%, a difference of 0.090%), Immigrants from Jordan (57.2%, a difference of 0.10%), Iraqi (57.1%, a difference of 0.29%), and Greek (57.5%, a difference of 0.42%).
| Demographics | Rating | Rank | 2 or more Vehicles in Household |
| Immigrants | Oceania | 98.2 /100 | #106 | Exceptional 57.5% |
| Immigrants | Netherlands | 98.2 /100 | #107 | Exceptional 57.5% |
| Immigrants | Canada | 98.1 /100 | #108 | Exceptional 57.5% |
| Immigrants | North America | 98.1 /100 | #109 | Exceptional 57.5% |
| Japanese | 98.0 /100 | #110 | Exceptional 57.5% |
| Greeks | 98.0 /100 | #111 | Exceptional 57.5% |
| Pueblo | 98.0 /100 | #112 | Exceptional 57.5% |
| Zimbabweans | 96.9 /100 | #113 | Exceptional 57.2% |
| Immigrants | Lebanon | 96.8 /100 | #114 | Exceptional 57.2% |
| Chippewa | 96.6 /100 | #115 | Exceptional 57.2% |
| Immigrants | Jordan | 96.6 /100 | #116 | Exceptional 57.2% |
| Iraqis | 95.8 /100 | #117 | Exceptional 57.1% |
| Asians | 95.1 /100 | #118 | Exceptional 57.0% |
| Natives/Alaskans | 95.0 /100 | #119 | Exceptional 57.0% |
| Costa Ricans | 94.7 /100 | #120 | Exceptional 56.9% |