Immigrants from Eastern Asia vs Immigrants from Colombia Disability Age 5 to 17
COMPARE
Immigrants from Eastern Asia
Immigrants from Colombia
Disability Age 5 to 17
Disability Age 5 to 17 Comparison
Immigrants from Eastern Asia
Immigrants from Colombia
4.6%
DISABILITY AGE 5 TO 17
100.0/ 100
METRIC RATING
9th/ 347
METRIC RANK
5.4%
DISABILITY AGE 5 TO 17
92.9/ 100
METRIC RATING
132nd/ 347
METRIC RANK
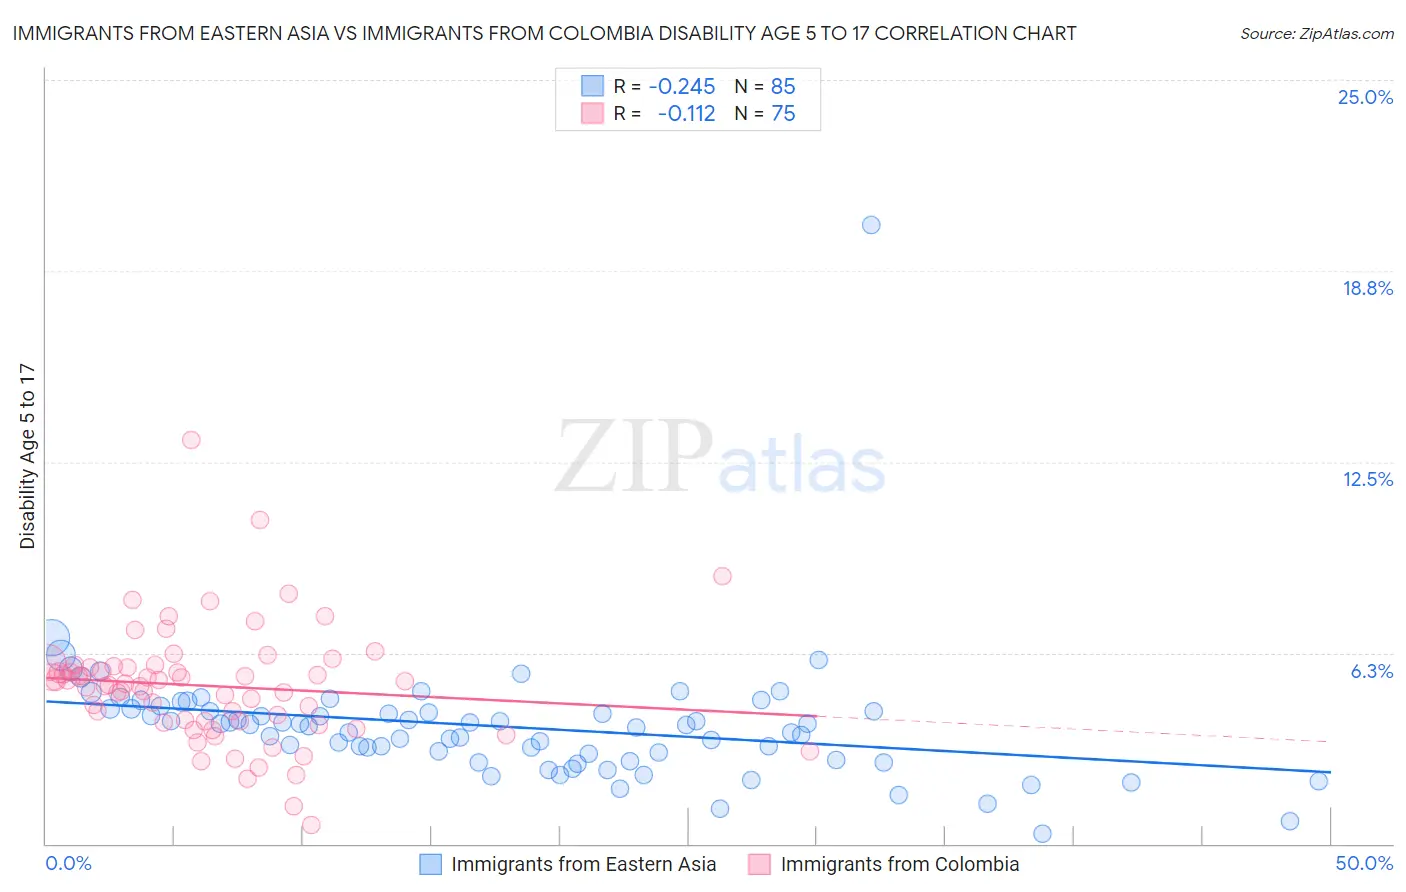
Immigrants from Eastern Asia vs Immigrants from Colombia Disability Age 5 to 17 Correlation Chart
The statistical analysis conducted on geographies consisting of 493,323,478 people shows a weak negative correlation between the proportion of Immigrants from Eastern Asia and percentage of population with a disability between the ages 5 and 17 in the United States with a correlation coefficient (R) of -0.245 and weighted average of 4.6%. Similarly, the statistical analysis conducted on geographies consisting of 376,032,819 people shows a poor negative correlation between the proportion of Immigrants from Colombia and percentage of population with a disability between the ages 5 and 17 in the United States with a correlation coefficient (R) of -0.112 and weighted average of 5.4%, a difference of 18.3%.
Disability Age 5 to 17 Correlation Summary
| Measurement | Immigrants from Eastern Asia | Immigrants from Colombia |
| Minimum | 0.35% | 0.60% |
| Maximum | 20.3% | 13.2% |
| Range | 19.9% | 12.6% |
| Mean | 3.8% | 5.2% |
| Median | 3.9% | 5.2% |
| Interquartile 25% (IQ1) | 2.8% | 4.0% |
| Interquartile 75% (IQ3) | 4.4% | 5.8% |
| Interquartile Range (IQR) | 1.6% | 1.8% |
| Standard Deviation (Sample) | 2.2% | 1.9% |
| Standard Deviation (Population) | 2.2% | 1.9% |
Similar Demographics by Disability Age 5 to 17
Demographics Similar to Immigrants from Eastern Asia by Disability Age 5 to 17
In terms of disability age 5 to 17, the demographic groups most similar to Immigrants from Eastern Asia are Immigrants from India (4.6%, a difference of 0.070%), Armenian (4.6%, a difference of 0.23%), Indian (Asian) (4.6%, a difference of 0.33%), Iranian (4.6%, a difference of 0.47%), and Immigrants from China (4.5%, a difference of 1.3%).
| Demographics | Rating | Rank | Disability Age 5 to 17 |
| Immigrants | Taiwan | 100.0 /100 | #2 | Exceptional 4.2% |
| Immigrants | Hong Kong | 100.0 /100 | #3 | Exceptional 4.3% |
| Filipinos | 100.0 /100 | #4 | Exceptional 4.3% |
| Immigrants | Iran | 100.0 /100 | #5 | Exceptional 4.4% |
| Immigrants | Israel | 100.0 /100 | #6 | Exceptional 4.5% |
| Immigrants | China | 100.0 /100 | #7 | Exceptional 4.5% |
| Indians (Asian) | 100.0 /100 | #8 | Exceptional 4.6% |
| Immigrants | Eastern Asia | 100.0 /100 | #9 | Exceptional 4.6% |
| Immigrants | India | 100.0 /100 | #10 | Exceptional 4.6% |
| Armenians | 100.0 /100 | #11 | Exceptional 4.6% |
| Iranians | 100.0 /100 | #12 | Exceptional 4.6% |
| Thais | 100.0 /100 | #13 | Exceptional 4.7% |
| Immigrants | Korea | 100.0 /100 | #14 | Exceptional 4.7% |
| Chinese | 100.0 /100 | #15 | Exceptional 4.7% |
| Immigrants | Singapore | 100.0 /100 | #16 | Exceptional 4.7% |
Demographics Similar to Immigrants from Colombia by Disability Age 5 to 17
In terms of disability age 5 to 17, the demographic groups most similar to Immigrants from Colombia are Arab (5.4%, a difference of 0.020%), Venezuelan (5.4%, a difference of 0.030%), Yuman (5.4%, a difference of 0.11%), Immigrants from Belize (5.4%, a difference of 0.21%), and Immigrants from Bulgaria (5.4%, a difference of 0.25%).
| Demographics | Rating | Rank | Disability Age 5 to 17 |
| Immigrants | Chile | 95.0 /100 | #125 | Exceptional 5.4% |
| New Zealanders | 95.0 /100 | #126 | Exceptional 5.4% |
| Latvians | 95.0 /100 | #127 | Exceptional 5.4% |
| Immigrants | Venezuela | 94.5 /100 | #128 | Exceptional 5.4% |
| Romanians | 94.1 /100 | #129 | Exceptional 5.4% |
| Immigrants | Bulgaria | 94.0 /100 | #130 | Exceptional 5.4% |
| Arabs | 92.9 /100 | #131 | Exceptional 5.4% |
| Immigrants | Colombia | 92.9 /100 | #132 | Exceptional 5.4% |
| Venezuelans | 92.7 /100 | #133 | Exceptional 5.4% |
| Yuman | 92.3 /100 | #134 | Exceptional 5.4% |
| Immigrants | Belize | 91.7 /100 | #135 | Exceptional 5.4% |
| Immigrants | Denmark | 91.4 /100 | #136 | Exceptional 5.4% |
| Navajo | 90.9 /100 | #137 | Exceptional 5.4% |
| Immigrants | Oceania | 90.8 /100 | #138 | Exceptional 5.4% |
| Belizeans | 90.8 /100 | #139 | Exceptional 5.4% |