Immigrants from Dominica vs Cree Divorced or Separated
COMPARE
Immigrants from Dominica
Cree
Divorced or Separated
Divorced or Separated Comparison
Immigrants from Dominica
Cree
12.6%
DIVORCED OR SEPARATED
0.5/ 100
METRIC RATING
261st/ 347
METRIC RANK
13.4%
DIVORCED OR SEPARATED
0.0/ 100
METRIC RATING
318th/ 347
METRIC RANK
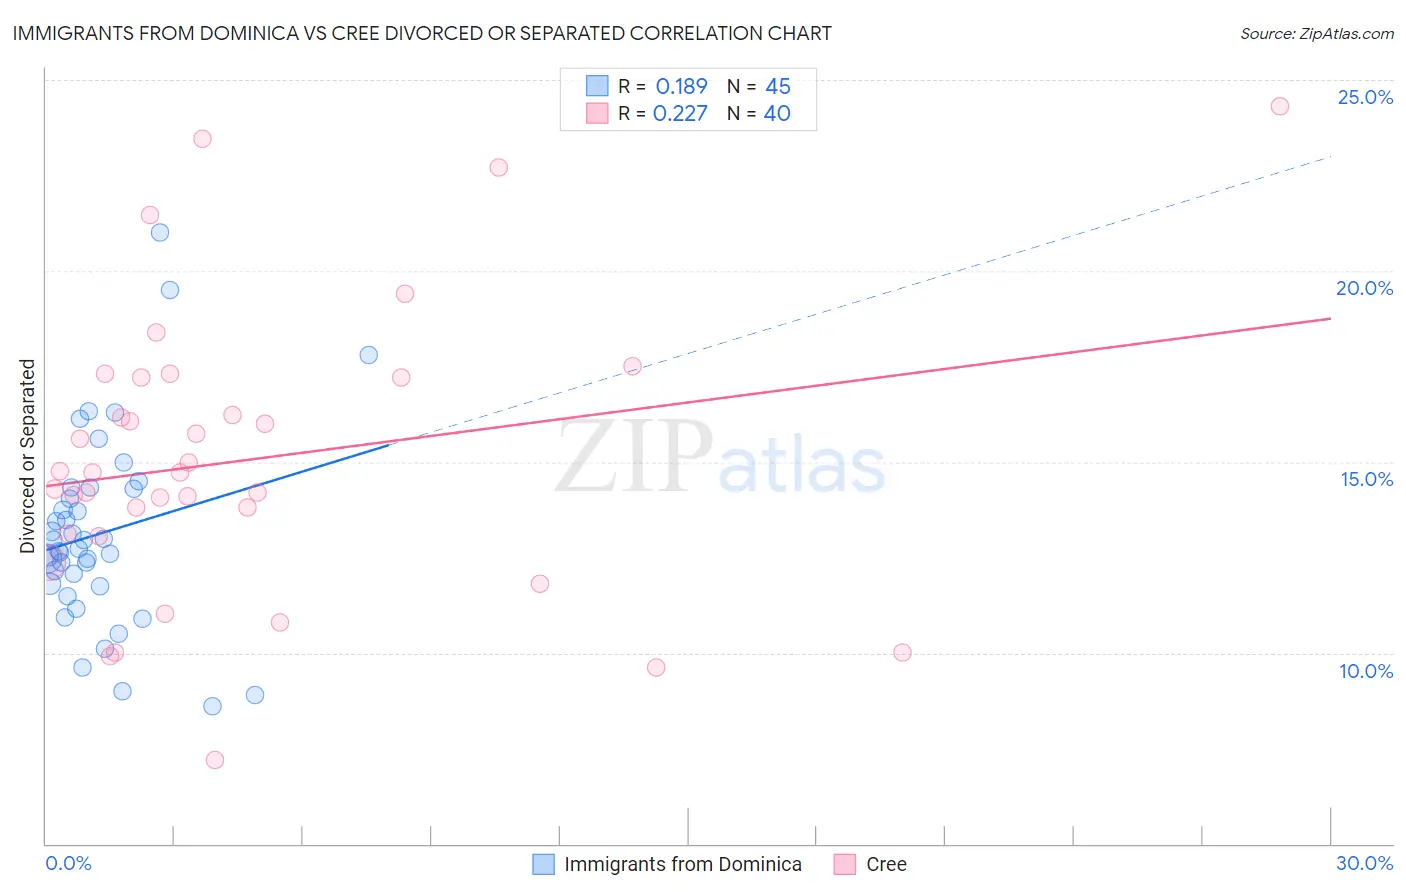
Immigrants from Dominica vs Cree Divorced or Separated Correlation Chart
The statistical analysis conducted on geographies consisting of 83,792,024 people shows a poor positive correlation between the proportion of Immigrants from Dominica and percentage of population currently divorced or separated in the United States with a correlation coefficient (R) of 0.189 and weighted average of 12.6%. Similarly, the statistical analysis conducted on geographies consisting of 76,211,532 people shows a weak positive correlation between the proportion of Cree and percentage of population currently divorced or separated in the United States with a correlation coefficient (R) of 0.227 and weighted average of 13.4%, a difference of 6.0%.
Divorced or Separated Correlation Summary
| Measurement | Immigrants from Dominica | Cree |
| Minimum | 8.6% | 7.2% |
| Maximum | 21.0% | 24.3% |
| Range | 12.4% | 17.1% |
| Mean | 13.1% | 15.1% |
| Median | 12.7% | 14.7% |
| Interquartile 25% (IQ1) | 11.8% | 13.1% |
| Interquartile 75% (IQ3) | 14.3% | 17.2% |
| Interquartile Range (IQR) | 2.5% | 4.1% |
| Standard Deviation (Sample) | 2.5% | 3.8% |
| Standard Deviation (Population) | 2.5% | 3.7% |
Similar Demographics by Divorced or Separated
Demographics Similar to Immigrants from Dominica by Divorced or Separated
In terms of divorced or separated, the demographic groups most similar to Immigrants from Dominica are Yuman (12.6%, a difference of 0.030%), Immigrants from Uruguay (12.6%, a difference of 0.030%), Immigrants from Somalia (12.6%, a difference of 0.050%), Indonesian (12.6%, a difference of 0.050%), and Basque (12.6%, a difference of 0.060%).
| Demographics | Rating | Rank | Divorced or Separated |
| Senegalese | 0.8 /100 | #254 | Tragic 12.6% |
| Welsh | 0.7 /100 | #255 | Tragic 12.6% |
| Immigrants | Colombia | 0.6 /100 | #256 | Tragic 12.6% |
| Immigrants | Somalia | 0.6 /100 | #257 | Tragic 12.6% |
| Indonesians | 0.6 /100 | #258 | Tragic 12.6% |
| Yuman | 0.6 /100 | #259 | Tragic 12.6% |
| Immigrants | Uruguay | 0.6 /100 | #260 | Tragic 12.6% |
| Immigrants | Dominica | 0.5 /100 | #261 | Tragic 12.6% |
| Basques | 0.5 /100 | #262 | Tragic 12.6% |
| Immigrants | Panama | 0.5 /100 | #263 | Tragic 12.6% |
| English | 0.5 /100 | #264 | Tragic 12.6% |
| Immigrants | Senegal | 0.5 /100 | #265 | Tragic 12.6% |
| Whites/Caucasians | 0.5 /100 | #266 | Tragic 12.6% |
| Scottish | 0.4 /100 | #267 | Tragic 12.6% |
| Fijians | 0.4 /100 | #268 | Tragic 12.6% |
Demographics Similar to Cree by Divorced or Separated
In terms of divorced or separated, the demographic groups most similar to Cree are Haitian (13.3%, a difference of 0.030%), Puget Sound Salish (13.4%, a difference of 0.040%), Tsimshian (13.3%, a difference of 0.050%), Spanish American (13.3%, a difference of 0.080%), and Cajun (13.4%, a difference of 0.10%).
| Demographics | Rating | Rank | Divorced or Separated |
| Sioux | 0.0 /100 | #311 | Tragic 13.2% |
| Blackfeet | 0.0 /100 | #312 | Tragic 13.3% |
| Immigrants | Nicaragua | 0.0 /100 | #313 | Tragic 13.3% |
| Yaqui | 0.0 /100 | #314 | Tragic 13.3% |
| Spanish Americans | 0.0 /100 | #315 | Tragic 13.3% |
| Tsimshian | 0.0 /100 | #316 | Tragic 13.3% |
| Haitians | 0.0 /100 | #317 | Tragic 13.3% |
| Cree | 0.0 /100 | #318 | Tragic 13.4% |
| Puget Sound Salish | 0.0 /100 | #319 | Tragic 13.4% |
| Cajuns | 0.0 /100 | #320 | Tragic 13.4% |
| Cheyenne | 0.0 /100 | #321 | Tragic 13.4% |
| Immigrants | Haiti | 0.0 /100 | #322 | Tragic 13.4% |
| U.S. Virgin Islanders | 0.0 /100 | #323 | Tragic 13.4% |
| Osage | 0.0 /100 | #324 | Tragic 13.4% |
| Potawatomi | 0.0 /100 | #325 | Tragic 13.5% |