Immigrants from Cuba vs Immigrants from Turkey 2 or more Vehicles in Household
COMPARE
Immigrants from Cuba
Immigrants from Turkey
2 or more Vehicles in Household
2 or more Vehicles in Household Comparison
Immigrants from Cuba
Immigrants from Turkey
55.3%
2 OR MORE VEHICLES IN HOUSEHOLD
47.0/ 100
METRIC RATING
176th/ 347
METRIC RANK
53.6%
2 OR MORE VEHICLES IN HOUSEHOLD
3.8/ 100
METRIC RATING
229th/ 347
METRIC RANK
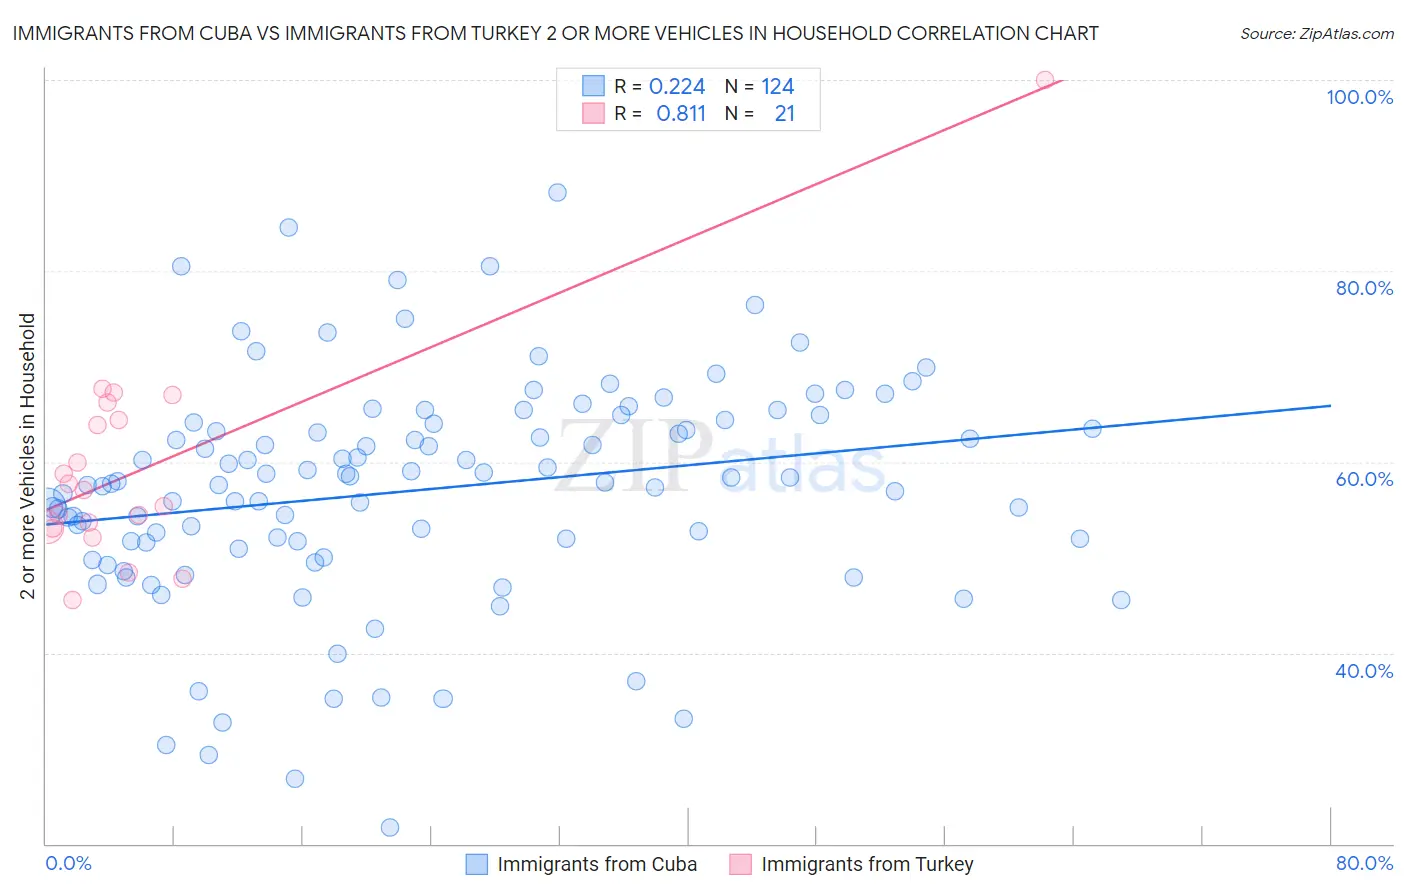
Immigrants from Cuba vs Immigrants from Turkey 2 or more Vehicles in Household Correlation Chart
The statistical analysis conducted on geographies consisting of 325,965,505 people shows a weak positive correlation between the proportion of Immigrants from Cuba and percentage of households with 2 or more vehicles available in the United States with a correlation coefficient (R) of 0.224 and weighted average of 55.3%. Similarly, the statistical analysis conducted on geographies consisting of 222,983,528 people shows a very strong positive correlation between the proportion of Immigrants from Turkey and percentage of households with 2 or more vehicles available in the United States with a correlation coefficient (R) of 0.811 and weighted average of 53.6%, a difference of 3.2%.
2 or more Vehicles in Household Correlation Summary
| Measurement | Immigrants from Cuba | Immigrants from Turkey |
| Minimum | 21.7% | 45.6% |
| Maximum | 88.2% | 100.0% |
| Range | 66.5% | 54.4% |
| Mean | 57.0% | 59.4% |
| Median | 57.9% | 57.0% |
| Interquartile 25% (IQ1) | 51.6% | 53.1% |
| Interquartile 75% (IQ3) | 64.0% | 65.3% |
| Interquartile Range (IQR) | 12.4% | 12.2% |
| Standard Deviation (Sample) | 11.7% | 11.4% |
| Standard Deviation (Population) | 11.7% | 11.2% |
Similar Demographics by 2 or more Vehicles in Household
Demographics Similar to Immigrants from Cuba by 2 or more Vehicles in Household
In terms of 2 or more vehicles in household, the demographic groups most similar to Immigrants from Cuba are Menominee (55.3%, a difference of 0.030%), Immigrants from Sweden (55.2%, a difference of 0.070%), Immigrants from Denmark (55.3%, a difference of 0.090%), Navajo (55.3%, a difference of 0.12%), and Immigrants from Western Europe (55.4%, a difference of 0.17%).
| Demographics | Rating | Rank | 2 or more Vehicles in Household |
| Immigrants | Austria | 56.3 /100 | #169 | Average 55.5% |
| Romanians | 55.8 /100 | #170 | Average 55.5% |
| Immigrants | Costa Rica | 54.4 /100 | #171 | Average 55.4% |
| Immigrants | Nicaragua | 51.6 /100 | #172 | Average 55.4% |
| Immigrants | Western Europe | 51.4 /100 | #173 | Average 55.4% |
| Navajo | 50.0 /100 | #174 | Average 55.3% |
| Immigrants | Denmark | 49.4 /100 | #175 | Average 55.3% |
| Immigrants | Cuba | 47.0 /100 | #176 | Average 55.3% |
| Menominee | 46.2 /100 | #177 | Average 55.3% |
| Immigrants | Sweden | 45.3 /100 | #178 | Average 55.2% |
| Alaskan Athabascans | 42.9 /100 | #179 | Average 55.2% |
| Immigrants | Kenya | 40.4 /100 | #180 | Average 55.1% |
| Immigrants | Micronesia | 38.2 /100 | #181 | Fair 55.1% |
| Cree | 38.2 /100 | #182 | Fair 55.1% |
| Immigrants | Cameroon | 37.3 /100 | #183 | Fair 55.1% |
Demographics Similar to Immigrants from Turkey by 2 or more Vehicles in Household
In terms of 2 or more vehicles in household, the demographic groups most similar to Immigrants from Turkey are Alaska Native (53.6%, a difference of 0.020%), Immigrants from Nepal (53.5%, a difference of 0.060%), Sudanese (53.6%, a difference of 0.080%), Panamanian (53.5%, a difference of 0.11%), and Immigrants from Guatemala (53.5%, a difference of 0.18%).
| Demographics | Rating | Rank | 2 or more Vehicles in Household |
| Kiowa | 6.2 /100 | #222 | Tragic 53.9% |
| Immigrants | Bosnia and Herzegovina | 5.5 /100 | #223 | Tragic 53.8% |
| Brazilians | 5.3 /100 | #224 | Tragic 53.8% |
| Immigrants | Egypt | 5.2 /100 | #225 | Tragic 53.8% |
| Immigrants | Eastern Africa | 5.1 /100 | #226 | Tragic 53.7% |
| Sudanese | 4.1 /100 | #227 | Tragic 53.6% |
| Alaska Natives | 3.9 /100 | #228 | Tragic 53.6% |
| Immigrants | Turkey | 3.8 /100 | #229 | Tragic 53.6% |
| Immigrants | Nepal | 3.6 /100 | #230 | Tragic 53.5% |
| Panamanians | 3.4 /100 | #231 | Tragic 53.5% |
| Immigrants | Guatemala | 3.2 /100 | #232 | Tragic 53.5% |
| Ugandans | 3.2 /100 | #233 | Tragic 53.5% |
| Immigrants | Switzerland | 3.0 /100 | #234 | Tragic 53.4% |
| Immigrants | Middle Africa | 3.0 /100 | #235 | Tragic 53.4% |
| Indonesians | 2.7 /100 | #236 | Tragic 53.4% |