Bhutanese vs Immigrants from Turkey 2 or more Vehicles in Household
COMPARE
Bhutanese
Immigrants from Turkey
2 or more Vehicles in Household
2 or more Vehicles in Household Comparison
Bhutanese
Immigrants from Turkey
59.1%
2 OR MORE VEHICLES IN HOUSEHOLD
99.9/ 100
METRIC RATING
54th/ 347
METRIC RANK
53.6%
2 OR MORE VEHICLES IN HOUSEHOLD
3.8/ 100
METRIC RATING
229th/ 347
METRIC RANK
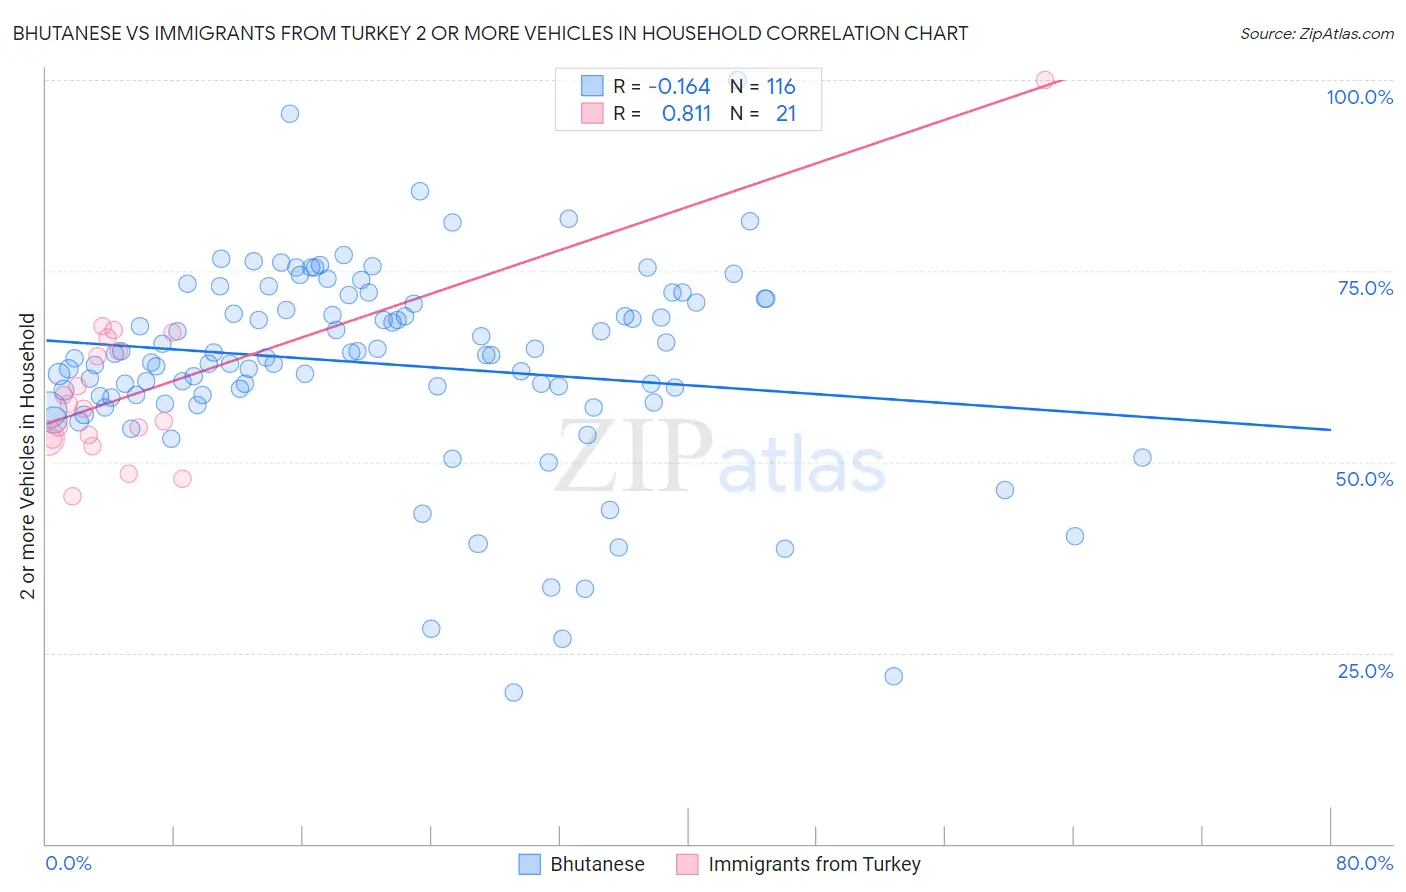
Bhutanese vs Immigrants from Turkey 2 or more Vehicles in Household Correlation Chart
The statistical analysis conducted on geographies consisting of 455,207,959 people shows a poor negative correlation between the proportion of Bhutanese and percentage of households with 2 or more vehicles available in the United States with a correlation coefficient (R) of -0.164 and weighted average of 59.1%. Similarly, the statistical analysis conducted on geographies consisting of 222,983,528 people shows a very strong positive correlation between the proportion of Immigrants from Turkey and percentage of households with 2 or more vehicles available in the United States with a correlation coefficient (R) of 0.811 and weighted average of 53.6%, a difference of 10.3%.
2 or more Vehicles in Household Correlation Summary
| Measurement | Bhutanese | Immigrants from Turkey |
| Minimum | 19.7% | 45.6% |
| Maximum | 100.0% | 100.0% |
| Range | 80.3% | 54.4% |
| Mean | 62.8% | 59.4% |
| Median | 63.8% | 57.0% |
| Interquartile 25% (IQ1) | 58.5% | 53.1% |
| Interquartile 75% (IQ3) | 71.1% | 65.3% |
| Interquartile Range (IQR) | 12.6% | 12.2% |
| Standard Deviation (Sample) | 13.2% | 11.4% |
| Standard Deviation (Population) | 13.1% | 11.2% |
Similar Demographics by 2 or more Vehicles in Household
Demographics Similar to Bhutanese by 2 or more Vehicles in Household
In terms of 2 or more vehicles in household, the demographic groups most similar to Bhutanese are Luxembourger (59.1%, a difference of 0.030%), Celtic (59.2%, a difference of 0.14%), Chickasaw (59.0%, a difference of 0.14%), Afghan (59.0%, a difference of 0.14%), and Spaniard (59.2%, a difference of 0.16%).
| Demographics | Rating | Rank | 2 or more Vehicles in Household |
| Yaqui | 99.9 /100 | #47 | Exceptional 59.3% |
| Immigrants | India | 99.9 /100 | #48 | Exceptional 59.3% |
| Belgians | 99.9 /100 | #49 | Exceptional 59.3% |
| Choctaw | 99.9 /100 | #50 | Exceptional 59.3% |
| Spaniards | 99.9 /100 | #51 | Exceptional 59.2% |
| Immigrants | Laos | 99.9 /100 | #52 | Exceptional 59.2% |
| Celtics | 99.9 /100 | #53 | Exceptional 59.2% |
| Bhutanese | 99.9 /100 | #54 | Exceptional 59.1% |
| Luxembourgers | 99.9 /100 | #55 | Exceptional 59.1% |
| Chickasaw | 99.9 /100 | #56 | Exceptional 59.0% |
| Afghans | 99.9 /100 | #57 | Exceptional 59.0% |
| Immigrants | Scotland | 99.8 /100 | #58 | Exceptional 58.9% |
| Spanish Americans | 99.8 /100 | #59 | Exceptional 58.9% |
| French Canadians | 99.8 /100 | #60 | Exceptional 58.9% |
| Osage | 99.8 /100 | #61 | Exceptional 58.8% |
Demographics Similar to Immigrants from Turkey by 2 or more Vehicles in Household
In terms of 2 or more vehicles in household, the demographic groups most similar to Immigrants from Turkey are Alaska Native (53.6%, a difference of 0.020%), Immigrants from Nepal (53.5%, a difference of 0.060%), Sudanese (53.6%, a difference of 0.080%), Panamanian (53.5%, a difference of 0.11%), and Immigrants from Guatemala (53.5%, a difference of 0.18%).
| Demographics | Rating | Rank | 2 or more Vehicles in Household |
| Kiowa | 6.2 /100 | #222 | Tragic 53.9% |
| Immigrants | Bosnia and Herzegovina | 5.5 /100 | #223 | Tragic 53.8% |
| Brazilians | 5.3 /100 | #224 | Tragic 53.8% |
| Immigrants | Egypt | 5.2 /100 | #225 | Tragic 53.8% |
| Immigrants | Eastern Africa | 5.1 /100 | #226 | Tragic 53.7% |
| Sudanese | 4.1 /100 | #227 | Tragic 53.6% |
| Alaska Natives | 3.9 /100 | #228 | Tragic 53.6% |
| Immigrants | Turkey | 3.8 /100 | #229 | Tragic 53.6% |
| Immigrants | Nepal | 3.6 /100 | #230 | Tragic 53.5% |
| Panamanians | 3.4 /100 | #231 | Tragic 53.5% |
| Immigrants | Guatemala | 3.2 /100 | #232 | Tragic 53.5% |
| Ugandans | 3.2 /100 | #233 | Tragic 53.5% |
| Immigrants | Switzerland | 3.0 /100 | #234 | Tragic 53.4% |
| Immigrants | Middle Africa | 3.0 /100 | #235 | Tragic 53.4% |
| Indonesians | 2.7 /100 | #236 | Tragic 53.4% |