Immigrants from Cuba vs Immigrants from Liberia 2 or more Vehicles in Household
COMPARE
Immigrants from Cuba
Immigrants from Liberia
2 or more Vehicles in Household
2 or more Vehicles in Household Comparison
Immigrants from Cuba
Immigrants from Liberia
55.3%
2 OR MORE VEHICLES IN HOUSEHOLD
47.0/ 100
METRIC RATING
176th/ 347
METRIC RANK
51.3%
2 OR MORE VEHICLES IN HOUSEHOLD
0.1/ 100
METRIC RATING
286th/ 347
METRIC RANK
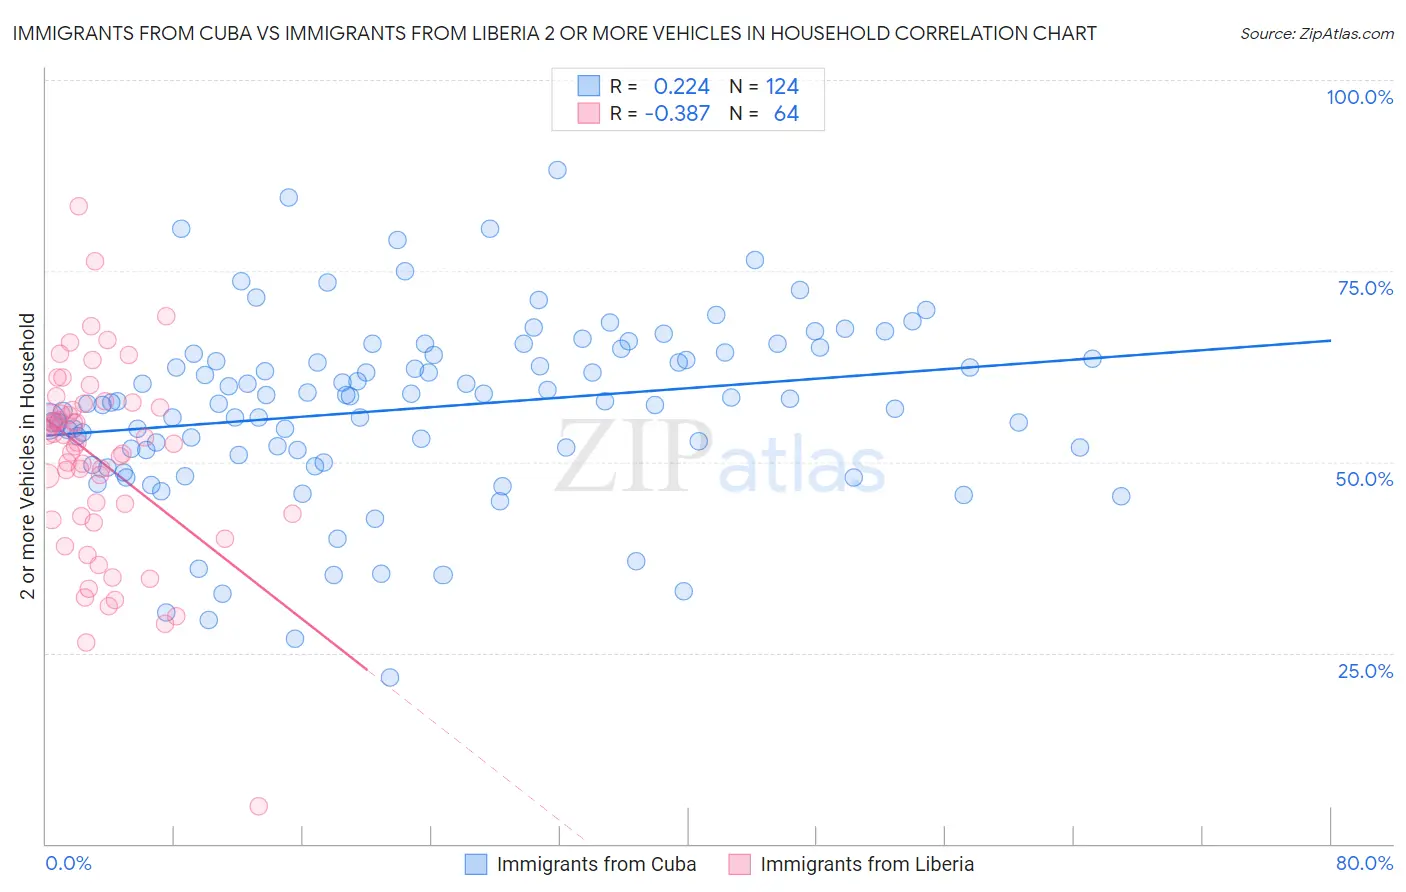
Immigrants from Cuba vs Immigrants from Liberia 2 or more Vehicles in Household Correlation Chart
The statistical analysis conducted on geographies consisting of 325,965,505 people shows a weak positive correlation between the proportion of Immigrants from Cuba and percentage of households with 2 or more vehicles available in the United States with a correlation coefficient (R) of 0.224 and weighted average of 55.3%. Similarly, the statistical analysis conducted on geographies consisting of 135,251,590 people shows a mild negative correlation between the proportion of Immigrants from Liberia and percentage of households with 2 or more vehicles available in the United States with a correlation coefficient (R) of -0.387 and weighted average of 51.3%, a difference of 7.7%.
2 or more Vehicles in Household Correlation Summary
| Measurement | Immigrants from Cuba | Immigrants from Liberia |
| Minimum | 21.7% | 4.9% |
| Maximum | 88.2% | 83.5% |
| Range | 66.5% | 78.6% |
| Mean | 57.0% | 50.3% |
| Median | 57.9% | 52.4% |
| Interquartile 25% (IQ1) | 51.6% | 42.7% |
| Interquartile 75% (IQ3) | 64.0% | 57.4% |
| Interquartile Range (IQR) | 12.4% | 14.7% |
| Standard Deviation (Sample) | 11.7% | 13.0% |
| Standard Deviation (Population) | 11.7% | 12.9% |
Similar Demographics by 2 or more Vehicles in Household
Demographics Similar to Immigrants from Cuba by 2 or more Vehicles in Household
In terms of 2 or more vehicles in household, the demographic groups most similar to Immigrants from Cuba are Menominee (55.3%, a difference of 0.030%), Immigrants from Sweden (55.2%, a difference of 0.070%), Immigrants from Denmark (55.3%, a difference of 0.090%), Navajo (55.3%, a difference of 0.12%), and Immigrants from Western Europe (55.4%, a difference of 0.17%).
| Demographics | Rating | Rank | 2 or more Vehicles in Household |
| Immigrants | Austria | 56.3 /100 | #169 | Average 55.5% |
| Romanians | 55.8 /100 | #170 | Average 55.5% |
| Immigrants | Costa Rica | 54.4 /100 | #171 | Average 55.4% |
| Immigrants | Nicaragua | 51.6 /100 | #172 | Average 55.4% |
| Immigrants | Western Europe | 51.4 /100 | #173 | Average 55.4% |
| Navajo | 50.0 /100 | #174 | Average 55.3% |
| Immigrants | Denmark | 49.4 /100 | #175 | Average 55.3% |
| Immigrants | Cuba | 47.0 /100 | #176 | Average 55.3% |
| Menominee | 46.2 /100 | #177 | Average 55.3% |
| Immigrants | Sweden | 45.3 /100 | #178 | Average 55.2% |
| Alaskan Athabascans | 42.9 /100 | #179 | Average 55.2% |
| Immigrants | Kenya | 40.4 /100 | #180 | Average 55.1% |
| Immigrants | Micronesia | 38.2 /100 | #181 | Fair 55.1% |
| Cree | 38.2 /100 | #182 | Fair 55.1% |
| Immigrants | Cameroon | 37.3 /100 | #183 | Fair 55.1% |
Demographics Similar to Immigrants from Liberia by 2 or more Vehicles in Household
In terms of 2 or more vehicles in household, the demographic groups most similar to Immigrants from Liberia are Immigrants from Serbia (51.3%, a difference of 0.020%), Immigrants from Uruguay (51.4%, a difference of 0.14%), Okinawan (51.2%, a difference of 0.14%), Immigrants from Zaire (51.5%, a difference of 0.30%), and Immigrants from China (51.5%, a difference of 0.34%).
| Demographics | Rating | Rank | 2 or more Vehicles in Household |
| Liberians | 0.1 /100 | #279 | Tragic 51.7% |
| Immigrants | Eastern Europe | 0.1 /100 | #280 | Tragic 51.7% |
| Immigrants | Kazakhstan | 0.1 /100 | #281 | Tragic 51.6% |
| Bahamians | 0.1 /100 | #282 | Tragic 51.5% |
| Immigrants | China | 0.1 /100 | #283 | Tragic 51.5% |
| Immigrants | Zaire | 0.1 /100 | #284 | Tragic 51.5% |
| Immigrants | Uruguay | 0.1 /100 | #285 | Tragic 51.4% |
| Immigrants | Liberia | 0.1 /100 | #286 | Tragic 51.3% |
| Immigrants | Serbia | 0.1 /100 | #287 | Tragic 51.3% |
| Okinawans | 0.1 /100 | #288 | Tragic 51.2% |
| Somalis | 0.0 /100 | #289 | Tragic 51.1% |
| Immigrants | Panama | 0.0 /100 | #290 | Tragic 51.1% |
| Belizeans | 0.0 /100 | #291 | Tragic 51.0% |
| Immigrants | Ukraine | 0.0 /100 | #292 | Tragic 50.9% |
| Blacks/African Americans | 0.0 /100 | #293 | Tragic 50.9% |