Blackfeet vs Immigrants from Turkey 2 or more Vehicles in Household
COMPARE
Blackfeet
Immigrants from Turkey
2 or more Vehicles in Household
2 or more Vehicles in Household Comparison
Blackfeet
Immigrants from Turkey
56.4%
2 OR MORE VEHICLES IN HOUSEHOLD
86.5/ 100
METRIC RATING
135th/ 347
METRIC RANK
53.6%
2 OR MORE VEHICLES IN HOUSEHOLD
3.8/ 100
METRIC RATING
229th/ 347
METRIC RANK
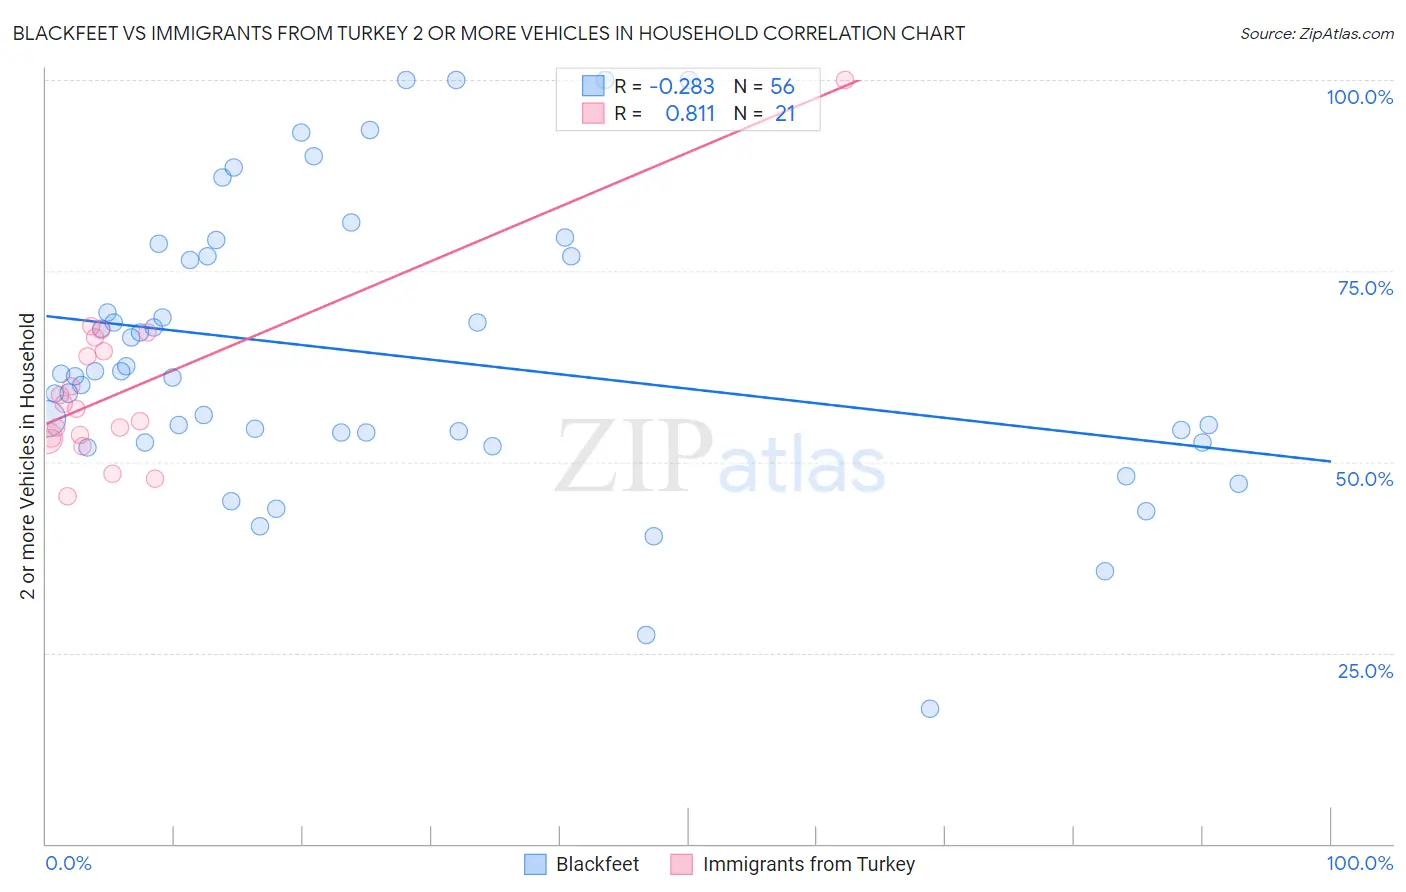
Blackfeet vs Immigrants from Turkey 2 or more Vehicles in Household Correlation Chart
The statistical analysis conducted on geographies consisting of 309,483,449 people shows a weak negative correlation between the proportion of Blackfeet and percentage of households with 2 or more vehicles available in the United States with a correlation coefficient (R) of -0.283 and weighted average of 56.4%. Similarly, the statistical analysis conducted on geographies consisting of 222,983,528 people shows a very strong positive correlation between the proportion of Immigrants from Turkey and percentage of households with 2 or more vehicles available in the United States with a correlation coefficient (R) of 0.811 and weighted average of 53.6%, a difference of 5.2%.
2 or more Vehicles in Household Correlation Summary
| Measurement | Blackfeet | Immigrants from Turkey |
| Minimum | 17.6% | 45.6% |
| Maximum | 100.0% | 100.0% |
| Range | 82.4% | 54.4% |
| Mean | 64.0% | 59.4% |
| Median | 61.3% | 57.0% |
| Interquartile 25% (IQ1) | 53.2% | 53.1% |
| Interquartile 75% (IQ3) | 76.8% | 65.3% |
| Interquartile Range (IQR) | 23.7% | 12.2% |
| Standard Deviation (Sample) | 18.5% | 11.4% |
| Standard Deviation (Population) | 18.3% | 11.2% |
Similar Demographics by 2 or more Vehicles in Household
Demographics Similar to Blackfeet by 2 or more Vehicles in Household
In terms of 2 or more vehicles in household, the demographic groups most similar to Blackfeet are Immigrants from the Azores (56.4%, a difference of 0.010%), Immigrants from Asia (56.3%, a difference of 0.040%), Cuban (56.3%, a difference of 0.13%), Salvadoran (56.3%, a difference of 0.14%), and Comanche (56.5%, a difference of 0.16%).
| Demographics | Rating | Rank | 2 or more Vehicles in Household |
| Immigrants | South Central Asia | 90.5 /100 | #128 | Exceptional 56.6% |
| Ute | 90.4 /100 | #129 | Exceptional 56.6% |
| Yugoslavians | 90.0 /100 | #130 | Exceptional 56.6% |
| Bulgarians | 89.7 /100 | #131 | Excellent 56.5% |
| Hungarians | 89.1 /100 | #132 | Excellent 56.5% |
| Comanche | 88.4 /100 | #133 | Excellent 56.5% |
| Immigrants | Azores | 86.6 /100 | #134 | Excellent 56.4% |
| Blackfeet | 86.5 /100 | #135 | Excellent 56.4% |
| Immigrants | Asia | 86.0 /100 | #136 | Excellent 56.3% |
| Cubans | 84.8 /100 | #137 | Excellent 56.3% |
| Salvadorans | 84.7 /100 | #138 | Excellent 56.3% |
| Armenians | 84.3 /100 | #139 | Excellent 56.3% |
| Latvians | 83.6 /100 | #140 | Excellent 56.2% |
| Immigrants | Cambodia | 83.6 /100 | #141 | Excellent 56.2% |
| South Africans | 83.1 /100 | #142 | Excellent 56.2% |
Demographics Similar to Immigrants from Turkey by 2 or more Vehicles in Household
In terms of 2 or more vehicles in household, the demographic groups most similar to Immigrants from Turkey are Alaska Native (53.6%, a difference of 0.020%), Immigrants from Nepal (53.5%, a difference of 0.060%), Sudanese (53.6%, a difference of 0.080%), Panamanian (53.5%, a difference of 0.11%), and Immigrants from Guatemala (53.5%, a difference of 0.18%).
| Demographics | Rating | Rank | 2 or more Vehicles in Household |
| Kiowa | 6.2 /100 | #222 | Tragic 53.9% |
| Immigrants | Bosnia and Herzegovina | 5.5 /100 | #223 | Tragic 53.8% |
| Brazilians | 5.3 /100 | #224 | Tragic 53.8% |
| Immigrants | Egypt | 5.2 /100 | #225 | Tragic 53.8% |
| Immigrants | Eastern Africa | 5.1 /100 | #226 | Tragic 53.7% |
| Sudanese | 4.1 /100 | #227 | Tragic 53.6% |
| Alaska Natives | 3.9 /100 | #228 | Tragic 53.6% |
| Immigrants | Turkey | 3.8 /100 | #229 | Tragic 53.6% |
| Immigrants | Nepal | 3.6 /100 | #230 | Tragic 53.5% |
| Panamanians | 3.4 /100 | #231 | Tragic 53.5% |
| Immigrants | Guatemala | 3.2 /100 | #232 | Tragic 53.5% |
| Ugandans | 3.2 /100 | #233 | Tragic 53.5% |
| Immigrants | Switzerland | 3.0 /100 | #234 | Tragic 53.4% |
| Immigrants | Middle Africa | 3.0 /100 | #235 | Tragic 53.4% |
| Indonesians | 2.7 /100 | #236 | Tragic 53.4% |