Immigrants from Cuba vs Salvadoran 2 or more Vehicles in Household
COMPARE
Immigrants from Cuba
Salvadoran
2 or more Vehicles in Household
2 or more Vehicles in Household Comparison
Immigrants from Cuba
Salvadorans
55.3%
2 OR MORE VEHICLES IN HOUSEHOLD
47.0/ 100
METRIC RATING
176th/ 347
METRIC RANK
56.3%
2 OR MORE VEHICLES IN HOUSEHOLD
84.7/ 100
METRIC RATING
138th/ 347
METRIC RANK
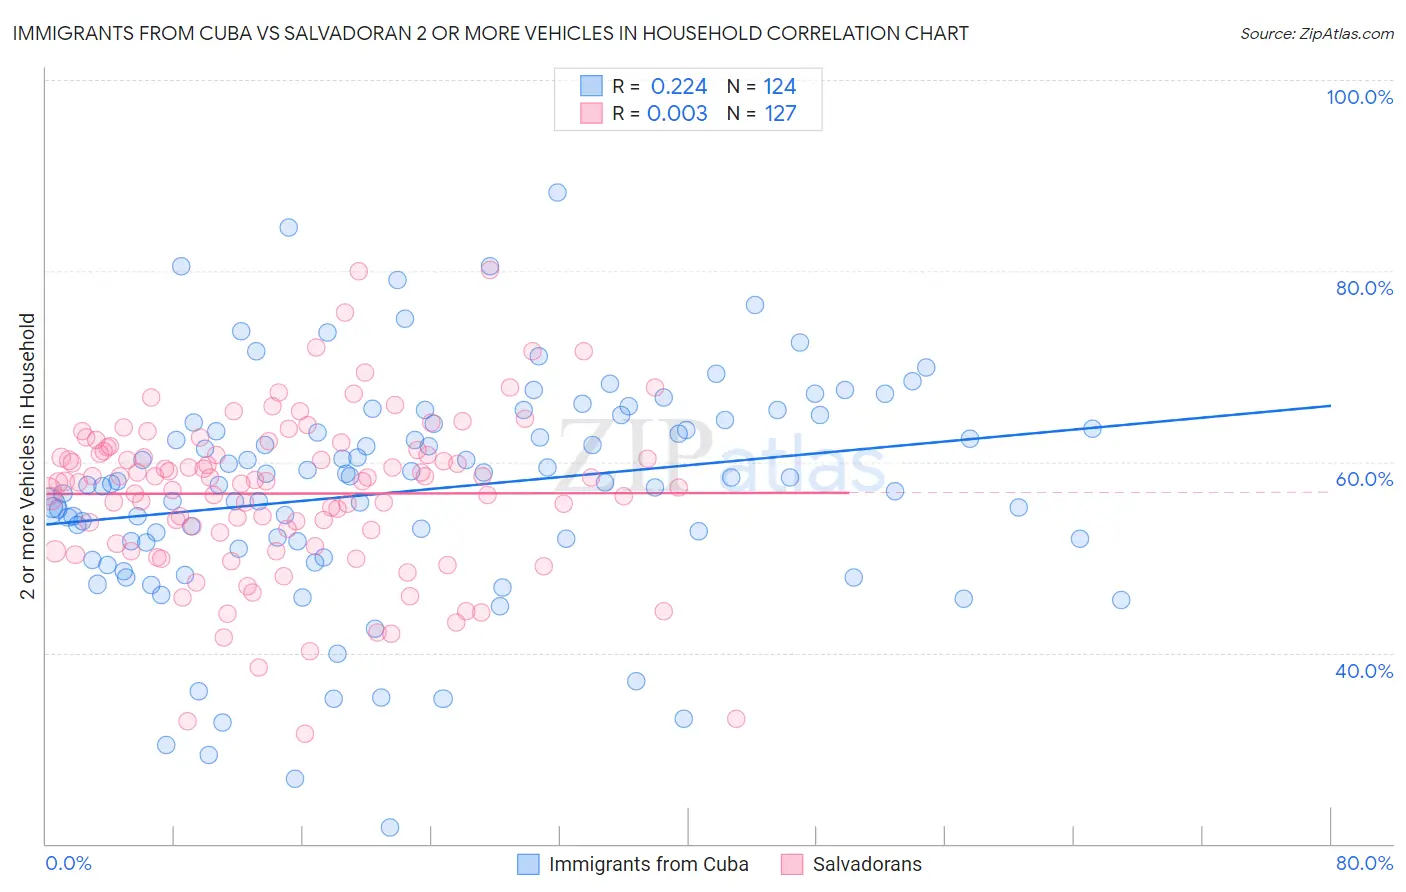
Immigrants from Cuba vs Salvadoran 2 or more Vehicles in Household Correlation Chart
The statistical analysis conducted on geographies consisting of 325,965,505 people shows a weak positive correlation between the proportion of Immigrants from Cuba and percentage of households with 2 or more vehicles available in the United States with a correlation coefficient (R) of 0.224 and weighted average of 55.3%. Similarly, the statistical analysis conducted on geographies consisting of 398,636,512 people shows no correlation between the proportion of Salvadorans and percentage of households with 2 or more vehicles available in the United States with a correlation coefficient (R) of 0.003 and weighted average of 56.3%, a difference of 1.8%.
2 or more Vehicles in Household Correlation Summary
| Measurement | Immigrants from Cuba | Salvadoran |
| Minimum | 21.7% | 31.5% |
| Maximum | 88.2% | 80.1% |
| Range | 66.5% | 48.6% |
| Mean | 57.0% | 56.7% |
| Median | 57.9% | 58.0% |
| Interquartile 25% (IQ1) | 51.6% | 51.5% |
| Interquartile 75% (IQ3) | 64.0% | 61.2% |
| Interquartile Range (IQR) | 12.4% | 9.8% |
| Standard Deviation (Sample) | 11.7% | 8.5% |
| Standard Deviation (Population) | 11.7% | 8.5% |
Similar Demographics by 2 or more Vehicles in Household
Demographics Similar to Immigrants from Cuba by 2 or more Vehicles in Household
In terms of 2 or more vehicles in household, the demographic groups most similar to Immigrants from Cuba are Menominee (55.3%, a difference of 0.030%), Immigrants from Sweden (55.2%, a difference of 0.070%), Immigrants from Denmark (55.3%, a difference of 0.090%), Navajo (55.3%, a difference of 0.12%), and Immigrants from Western Europe (55.4%, a difference of 0.17%).
| Demographics | Rating | Rank | 2 or more Vehicles in Household |
| Immigrants | Austria | 56.3 /100 | #169 | Average 55.5% |
| Romanians | 55.8 /100 | #170 | Average 55.5% |
| Immigrants | Costa Rica | 54.4 /100 | #171 | Average 55.4% |
| Immigrants | Nicaragua | 51.6 /100 | #172 | Average 55.4% |
| Immigrants | Western Europe | 51.4 /100 | #173 | Average 55.4% |
| Navajo | 50.0 /100 | #174 | Average 55.3% |
| Immigrants | Denmark | 49.4 /100 | #175 | Average 55.3% |
| Immigrants | Cuba | 47.0 /100 | #176 | Average 55.3% |
| Menominee | 46.2 /100 | #177 | Average 55.3% |
| Immigrants | Sweden | 45.3 /100 | #178 | Average 55.2% |
| Alaskan Athabascans | 42.9 /100 | #179 | Average 55.2% |
| Immigrants | Kenya | 40.4 /100 | #180 | Average 55.1% |
| Immigrants | Micronesia | 38.2 /100 | #181 | Fair 55.1% |
| Cree | 38.2 /100 | #182 | Fair 55.1% |
| Immigrants | Cameroon | 37.3 /100 | #183 | Fair 55.1% |
Demographics Similar to Salvadorans by 2 or more Vehicles in Household
In terms of 2 or more vehicles in household, the demographic groups most similar to Salvadorans are Cuban (56.3%, a difference of 0.010%), Armenian (56.3%, a difference of 0.030%), Latvian (56.2%, a difference of 0.080%), Immigrants from Cambodia (56.2%, a difference of 0.080%), and Immigrants from Asia (56.3%, a difference of 0.10%).
| Demographics | Rating | Rank | 2 or more Vehicles in Household |
| Bulgarians | 89.7 /100 | #131 | Excellent 56.5% |
| Hungarians | 89.1 /100 | #132 | Excellent 56.5% |
| Comanche | 88.4 /100 | #133 | Excellent 56.5% |
| Immigrants | Azores | 86.6 /100 | #134 | Excellent 56.4% |
| Blackfeet | 86.5 /100 | #135 | Excellent 56.4% |
| Immigrants | Asia | 86.0 /100 | #136 | Excellent 56.3% |
| Cubans | 84.8 /100 | #137 | Excellent 56.3% |
| Salvadorans | 84.7 /100 | #138 | Excellent 56.3% |
| Armenians | 84.3 /100 | #139 | Excellent 56.3% |
| Latvians | 83.6 /100 | #140 | Excellent 56.2% |
| Immigrants | Cambodia | 83.6 /100 | #141 | Excellent 56.2% |
| South Africans | 83.1 /100 | #142 | Excellent 56.2% |
| Seminole | 81.7 /100 | #143 | Excellent 56.2% |
| Immigrants | Syria | 81.4 /100 | #144 | Excellent 56.2% |
| Syrians | 81.2 /100 | #145 | Excellent 56.2% |