Immigrants from Romania vs Immigrants from Turkey 2 or more Vehicles in Household
COMPARE
Immigrants from Romania
Immigrants from Turkey
2 or more Vehicles in Household
2 or more Vehicles in Household Comparison
Immigrants from Romania
Immigrants from Turkey
54.7%
2 OR MORE VEHICLES IN HOUSEHOLD
23.8/ 100
METRIC RATING
192nd/ 347
METRIC RANK
53.6%
2 OR MORE VEHICLES IN HOUSEHOLD
3.8/ 100
METRIC RATING
229th/ 347
METRIC RANK
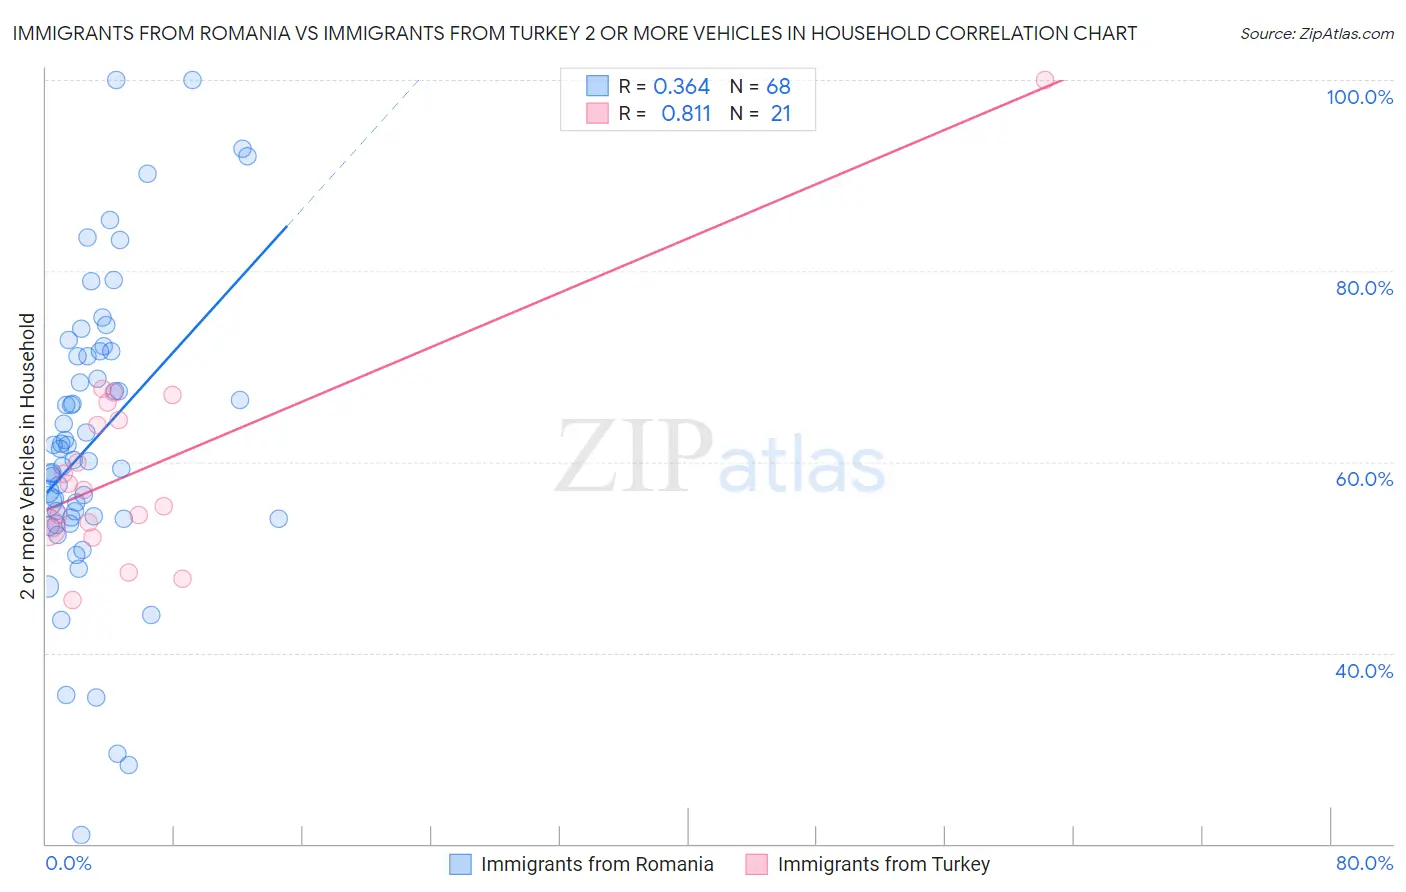
Immigrants from Romania vs Immigrants from Turkey 2 or more Vehicles in Household Correlation Chart
The statistical analysis conducted on geographies consisting of 256,931,025 people shows a mild positive correlation between the proportion of Immigrants from Romania and percentage of households with 2 or more vehicles available in the United States with a correlation coefficient (R) of 0.364 and weighted average of 54.7%. Similarly, the statistical analysis conducted on geographies consisting of 222,983,528 people shows a very strong positive correlation between the proportion of Immigrants from Turkey and percentage of households with 2 or more vehicles available in the United States with a correlation coefficient (R) of 0.811 and weighted average of 53.6%, a difference of 2.1%.
2 or more Vehicles in Household Correlation Summary
| Measurement | Immigrants from Romania | Immigrants from Turkey |
| Minimum | 20.9% | 45.6% |
| Maximum | 100.0% | 100.0% |
| Range | 79.1% | 54.4% |
| Mean | 62.3% | 59.4% |
| Median | 60.8% | 57.0% |
| Interquartile 25% (IQ1) | 54.1% | 53.1% |
| Interquartile 75% (IQ3) | 71.3% | 65.3% |
| Interquartile Range (IQR) | 17.2% | 12.2% |
| Standard Deviation (Sample) | 15.6% | 11.4% |
| Standard Deviation (Population) | 15.5% | 11.2% |
Similar Demographics by 2 or more Vehicles in Household
Demographics Similar to Immigrants from Romania by 2 or more Vehicles in Household
In terms of 2 or more vehicles in household, the demographic groups most similar to Immigrants from Romania are Immigrants from Japan (54.7%, a difference of 0.020%), Central American (54.7%, a difference of 0.050%), Immigrants (54.7%, a difference of 0.060%), Iroquois (54.7%, a difference of 0.070%), and Russian (54.8%, a difference of 0.13%).
| Demographics | Rating | Rank | 2 or more Vehicles in Household |
| Arabs | 35.9 /100 | #185 | Fair 55.0% |
| Peruvians | 33.7 /100 | #186 | Fair 55.0% |
| Immigrants | Uganda | 33.4 /100 | #187 | Fair 55.0% |
| Marshallese | 30.5 /100 | #188 | Fair 54.9% |
| Eastern Europeans | 27.5 /100 | #189 | Fair 54.8% |
| Russians | 26.3 /100 | #190 | Fair 54.8% |
| Immigrants | Immigrants | 25.0 /100 | #191 | Fair 54.7% |
| Immigrants | Romania | 23.8 /100 | #192 | Fair 54.7% |
| Immigrants | Japan | 23.4 /100 | #193 | Fair 54.7% |
| Central Americans | 23.0 /100 | #194 | Fair 54.7% |
| Iroquois | 22.6 /100 | #195 | Fair 54.7% |
| Immigrants | Poland | 19.3 /100 | #196 | Poor 54.6% |
| Argentineans | 17.5 /100 | #197 | Poor 54.5% |
| Carpatho Rusyns | 16.2 /100 | #198 | Poor 54.4% |
| Immigrants | Norway | 15.9 /100 | #199 | Poor 54.4% |
Demographics Similar to Immigrants from Turkey by 2 or more Vehicles in Household
In terms of 2 or more vehicles in household, the demographic groups most similar to Immigrants from Turkey are Alaska Native (53.6%, a difference of 0.020%), Immigrants from Nepal (53.5%, a difference of 0.060%), Sudanese (53.6%, a difference of 0.080%), Panamanian (53.5%, a difference of 0.11%), and Immigrants from Guatemala (53.5%, a difference of 0.18%).
| Demographics | Rating | Rank | 2 or more Vehicles in Household |
| Kiowa | 6.2 /100 | #222 | Tragic 53.9% |
| Immigrants | Bosnia and Herzegovina | 5.5 /100 | #223 | Tragic 53.8% |
| Brazilians | 5.3 /100 | #224 | Tragic 53.8% |
| Immigrants | Egypt | 5.2 /100 | #225 | Tragic 53.8% |
| Immigrants | Eastern Africa | 5.1 /100 | #226 | Tragic 53.7% |
| Sudanese | 4.1 /100 | #227 | Tragic 53.6% |
| Alaska Natives | 3.9 /100 | #228 | Tragic 53.6% |
| Immigrants | Turkey | 3.8 /100 | #229 | Tragic 53.6% |
| Immigrants | Nepal | 3.6 /100 | #230 | Tragic 53.5% |
| Panamanians | 3.4 /100 | #231 | Tragic 53.5% |
| Immigrants | Guatemala | 3.2 /100 | #232 | Tragic 53.5% |
| Ugandans | 3.2 /100 | #233 | Tragic 53.5% |
| Immigrants | Switzerland | 3.0 /100 | #234 | Tragic 53.4% |
| Immigrants | Middle Africa | 3.0 /100 | #235 | Tragic 53.4% |
| Indonesians | 2.7 /100 | #236 | Tragic 53.4% |