Shoshone vs Black/African American 3 or more Vehicles in Household
COMPARE
Shoshone
Black/African American
3 or more Vehicles in Household
3 or more Vehicles in Household Comparison
Shoshone
Blacks/African Americans
24.9%
3 OR MORE VEHICLES IN HOUSEHOLD
100.0/ 100
METRIC RATING
11th/ 347
METRIC RANK
17.3%
3 OR MORE VEHICLES IN HOUSEHOLD
0.3/ 100
METRIC RATING
283rd/ 347
METRIC RANK
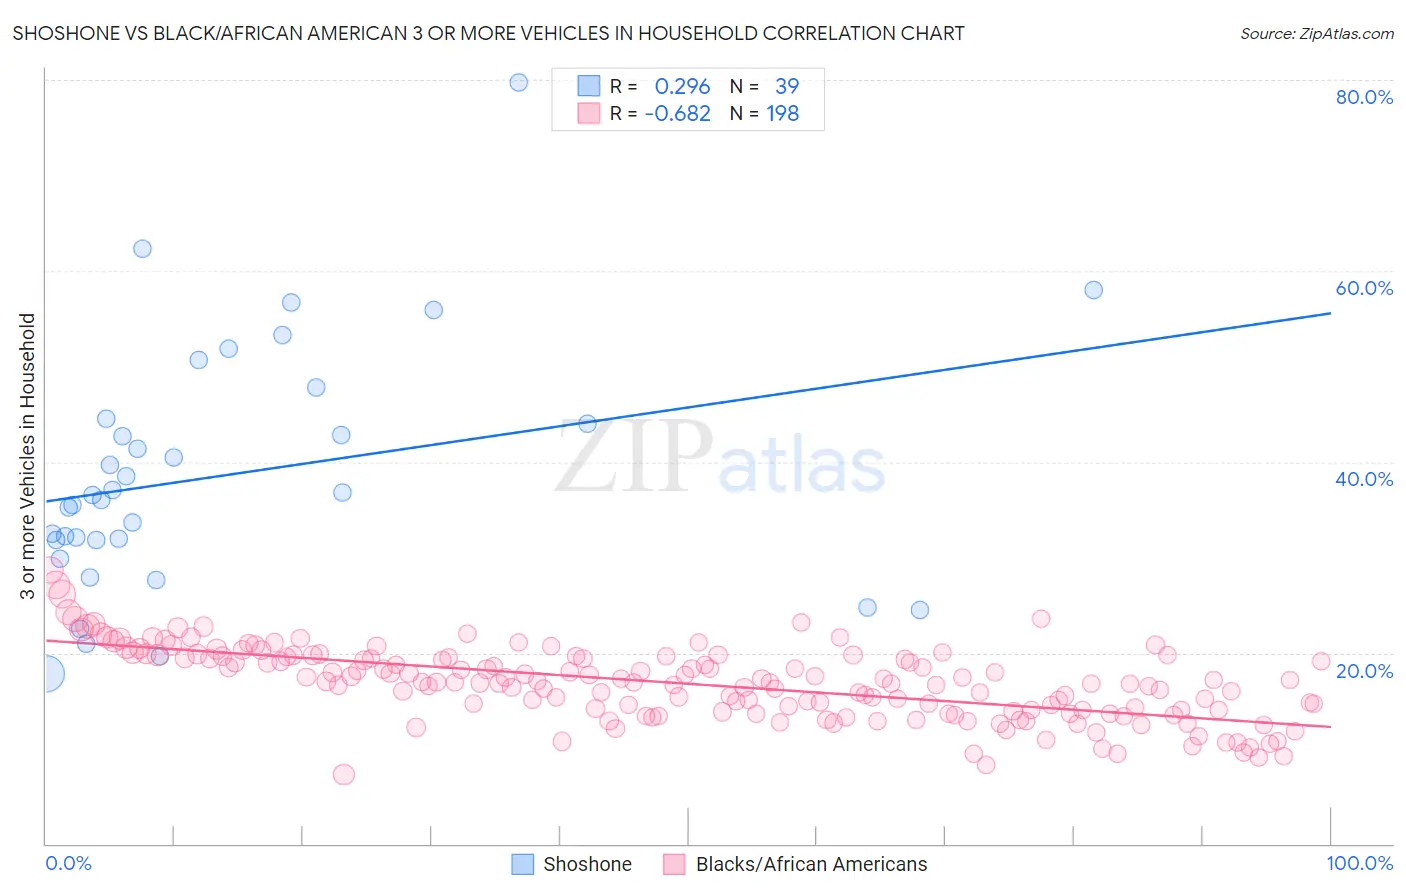
Shoshone vs Black/African American 3 or more Vehicles in Household Correlation Chart
The statistical analysis conducted on geographies consisting of 66,615,366 people shows a weak positive correlation between the proportion of Shoshone and percentage of households with 3 or more vehicles available in the United States with a correlation coefficient (R) of 0.296 and weighted average of 24.9%. Similarly, the statistical analysis conducted on geographies consisting of 564,977,074 people shows a significant negative correlation between the proportion of Blacks/African Americans and percentage of households with 3 or more vehicles available in the United States with a correlation coefficient (R) of -0.682 and weighted average of 17.3%, a difference of 43.6%.
3 or more Vehicles in Household Correlation Summary
| Measurement | Shoshone | Black/African American |
| Minimum | 17.9% | 7.2% |
| Maximum | 79.7% | 28.7% |
| Range | 61.9% | 21.4% |
| Mean | 38.7% | 16.8% |
| Median | 36.5% | 16.9% |
| Interquartile 25% (IQ1) | 31.8% | 14.0% |
| Interquartile 75% (IQ3) | 44.5% | 19.6% |
| Interquartile Range (IQR) | 12.7% | 5.6% |
| Standard Deviation (Sample) | 13.0% | 3.8% |
| Standard Deviation (Population) | 12.8% | 3.8% |
Similar Demographics by 3 or more Vehicles in Household
Demographics Similar to Shoshone by 3 or more Vehicles in Household
In terms of 3 or more vehicles in household, the demographic groups most similar to Shoshone are Nepalese (24.9%, a difference of 0.10%), Native Hawaiian (24.9%, a difference of 0.19%), Samoan (25.0%, a difference of 0.29%), Danish (24.7%, a difference of 0.69%), and Mexican (24.7%, a difference of 0.77%).
| Demographics | Rating | Rank | 3 or more Vehicles in Household |
| Arapaho | 100.0 /100 | #4 | Exceptional 26.4% |
| Puget Sound Salish | 100.0 /100 | #5 | Exceptional 26.4% |
| Immigrants | Fiji | 100.0 /100 | #6 | Exceptional 26.1% |
| Colville | 100.0 /100 | #7 | Exceptional 25.8% |
| Samoans | 100.0 /100 | #8 | Exceptional 25.0% |
| Native Hawaiians | 100.0 /100 | #9 | Exceptional 24.9% |
| Nepalese | 100.0 /100 | #10 | Exceptional 24.9% |
| Shoshone | 100.0 /100 | #11 | Exceptional 24.9% |
| Danes | 100.0 /100 | #12 | Exceptional 24.7% |
| Mexicans | 100.0 /100 | #13 | Exceptional 24.7% |
| Immigrants | Mexico | 100.0 /100 | #14 | Exceptional 24.6% |
| Hawaiians | 100.0 /100 | #15 | Exceptional 24.3% |
| Basques | 100.0 /100 | #16 | Exceptional 24.3% |
| Koreans | 100.0 /100 | #17 | Exceptional 24.1% |
| Norwegians | 100.0 /100 | #18 | Exceptional 23.9% |
Demographics Similar to Blacks/African Americans by 3 or more Vehicles in Household
In terms of 3 or more vehicles in household, the demographic groups most similar to Blacks/African Americans are Immigrants from Ireland (17.3%, a difference of 0.050%), Immigrants from Colombia (17.3%, a difference of 0.12%), Immigrants from Latvia (17.4%, a difference of 0.34%), Immigrants from Eastern Europe (17.4%, a difference of 0.38%), and Immigrants from Kazakhstan (17.4%, a difference of 0.42%).
| Demographics | Rating | Rank | 3 or more Vehicles in Household |
| Okinawans | 0.4 /100 | #276 | Tragic 17.4% |
| Brazilians | 0.4 /100 | #277 | Tragic 17.4% |
| Immigrants | Bahamas | 0.3 /100 | #278 | Tragic 17.4% |
| Immigrants | Kazakhstan | 0.3 /100 | #279 | Tragic 17.4% |
| Immigrants | Eastern Europe | 0.3 /100 | #280 | Tragic 17.4% |
| Immigrants | Latvia | 0.3 /100 | #281 | Tragic 17.4% |
| Immigrants | Ireland | 0.3 /100 | #282 | Tragic 17.3% |
| Blacks/African Americans | 0.3 /100 | #283 | Tragic 17.3% |
| Immigrants | Colombia | 0.3 /100 | #284 | Tragic 17.3% |
| Immigrants | Croatia | 0.2 /100 | #285 | Tragic 17.2% |
| Menominee | 0.2 /100 | #286 | Tragic 17.2% |
| Immigrants | Brazil | 0.2 /100 | #287 | Tragic 17.1% |
| Immigrants | Uruguay | 0.2 /100 | #288 | Tragic 17.1% |
| Immigrants | Liberia | 0.1 /100 | #289 | Tragic 17.1% |
| Liberians | 0.1 /100 | #290 | Tragic 17.0% |