Immigrants from Cameroon vs Immigrants from Eritrea 5th Grade
COMPARE
Immigrants from Cameroon
Immigrants from Eritrea
5th Grade
5th Grade Comparison
Immigrants from Cameroon
Immigrants from Eritrea
96.7%
5TH GRADE
0.1/ 100
METRIC RATING
274th/ 347
METRIC RANK
96.4%
5TH GRADE
0.0/ 100
METRIC RATING
294th/ 347
METRIC RANK
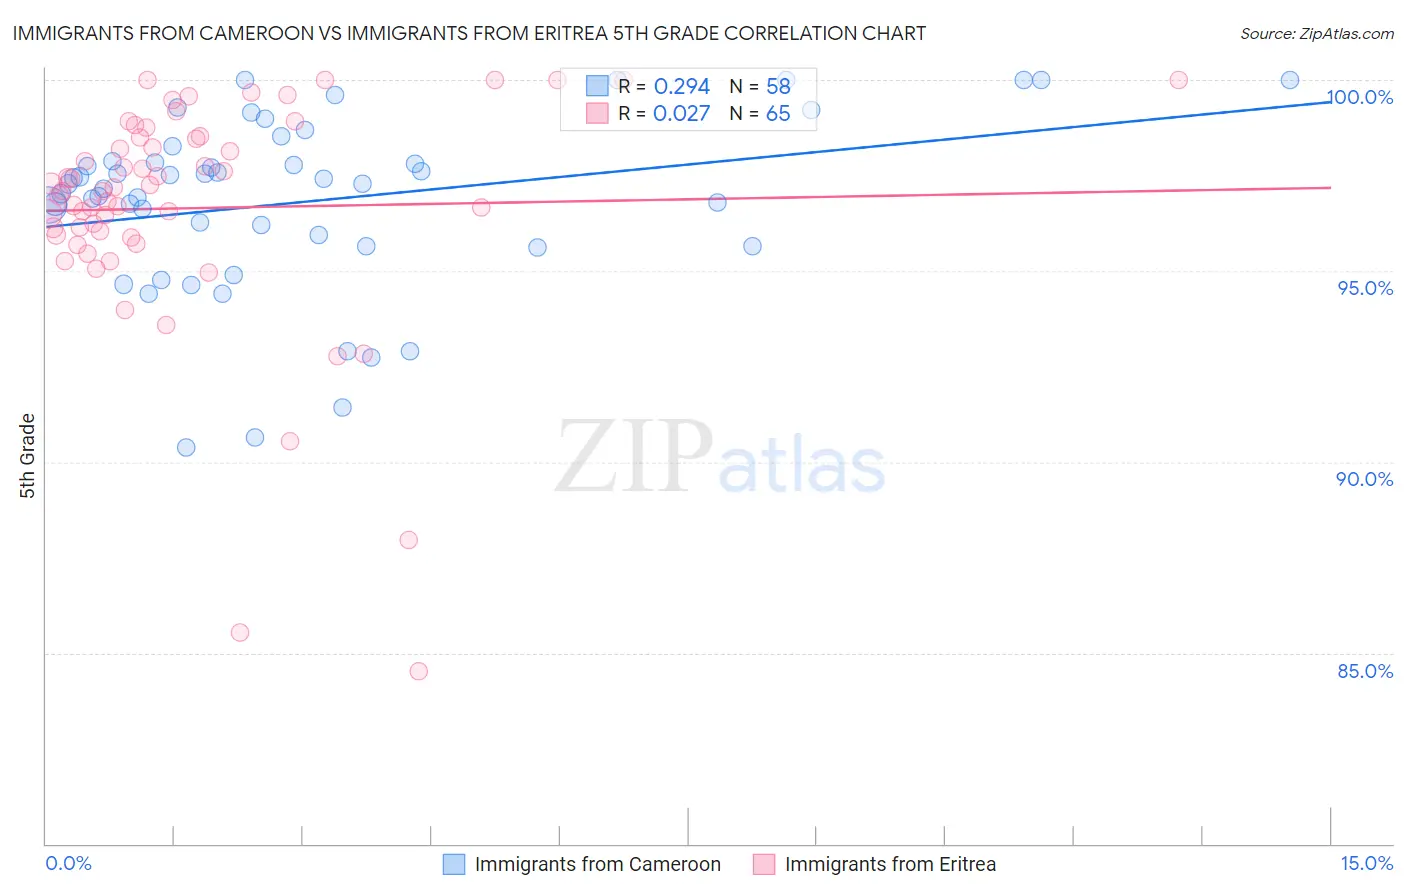
Immigrants from Cameroon vs Immigrants from Eritrea 5th Grade Correlation Chart
The statistical analysis conducted on geographies consisting of 130,752,798 people shows a weak positive correlation between the proportion of Immigrants from Cameroon and percentage of population with at least 5th grade education in the United States with a correlation coefficient (R) of 0.294 and weighted average of 96.7%. Similarly, the statistical analysis conducted on geographies consisting of 104,792,854 people shows no correlation between the proportion of Immigrants from Eritrea and percentage of population with at least 5th grade education in the United States with a correlation coefficient (R) of 0.027 and weighted average of 96.4%, a difference of 0.25%.
5th Grade Correlation Summary
| Measurement | Immigrants from Cameroon | Immigrants from Eritrea |
| Minimum | 90.4% | 84.5% |
| Maximum | 100.0% | 100.0% |
| Range | 9.6% | 15.5% |
| Mean | 96.8% | 96.6% |
| Median | 97.3% | 97.1% |
| Interquartile 25% (IQ1) | 95.7% | 95.9% |
| Interquartile 75% (IQ3) | 97.9% | 98.5% |
| Interquartile Range (IQR) | 2.2% | 2.6% |
| Standard Deviation (Sample) | 2.3% | 3.1% |
| Standard Deviation (Population) | 2.3% | 3.0% |
Demographics Similar to Immigrants from Cameroon and Immigrants from Eritrea by 5th Grade
In terms of 5th grade, the demographic groups most similar to Immigrants from Cameroon are Immigrants from Peru (96.6%, a difference of 0.010%), Cuban (96.6%, a difference of 0.010%), Immigrants from Bolivia (96.6%, a difference of 0.010%), Immigrants from Ghana (96.6%, a difference of 0.020%), and Immigrants from Philippines (96.6%, a difference of 0.040%). Similarly, the demographic groups most similar to Immigrants from Eritrea are Immigrants from Grenada (96.5%, a difference of 0.040%), Somali (96.5%, a difference of 0.050%), British West Indian (96.5%, a difference of 0.060%), Malaysian (96.5%, a difference of 0.060%), and Immigrants from West Indies (96.5%, a difference of 0.080%).
| Demographics | Rating | Rank | 5th Grade |
| Immigrants | Cameroon | 0.1 /100 | #274 | Tragic 96.7% |
| Immigrants | Peru | 0.1 /100 | #275 | Tragic 96.6% |
| Cubans | 0.1 /100 | #276 | Tragic 96.6% |
| Immigrants | Bolivia | 0.1 /100 | #277 | Tragic 96.6% |
| Immigrants | Ghana | 0.1 /100 | #278 | Tragic 96.6% |
| Immigrants | Philippines | 0.1 /100 | #279 | Tragic 96.6% |
| Immigrants | Western Africa | 0.1 /100 | #280 | Tragic 96.6% |
| Houma | 0.1 /100 | #281 | Tragic 96.6% |
| Barbadians | 0.1 /100 | #282 | Tragic 96.6% |
| Fijians | 0.1 /100 | #283 | Tragic 96.6% |
| Immigrants | Trinidad and Tobago | 0.1 /100 | #284 | Tragic 96.6% |
| Immigrants | St. Vincent and the Grenadines | 0.1 /100 | #285 | Tragic 96.6% |
| Immigrants | Thailand | 0.1 /100 | #286 | Tragic 96.6% |
| Immigrants | Afghanistan | 0.1 /100 | #287 | Tragic 96.6% |
| Immigrants | Barbados | 0.0 /100 | #288 | Tragic 96.6% |
| Immigrants | West Indies | 0.0 /100 | #289 | Tragic 96.5% |
| British West Indians | 0.0 /100 | #290 | Tragic 96.5% |
| Malaysians | 0.0 /100 | #291 | Tragic 96.5% |
| Somalis | 0.0 /100 | #292 | Tragic 96.5% |
| Immigrants | Grenada | 0.0 /100 | #293 | Tragic 96.5% |
| Immigrants | Eritrea | 0.0 /100 | #294 | Tragic 96.4% |