Immigrants from Cabo Verde vs Guyanese 2 or more Vehicles in Household
COMPARE
Immigrants from Cabo Verde
Guyanese
2 or more Vehicles in Household
2 or more Vehicles in Household Comparison
Immigrants from Cabo Verde
Guyanese
43.3%
2 OR MORE VEHICLES IN HOUSEHOLD
0.0/ 100
METRIC RATING
324th/ 347
METRIC RANK
35.4%
2 OR MORE VEHICLES IN HOUSEHOLD
0.0/ 100
METRIC RATING
341st/ 347
METRIC RANK
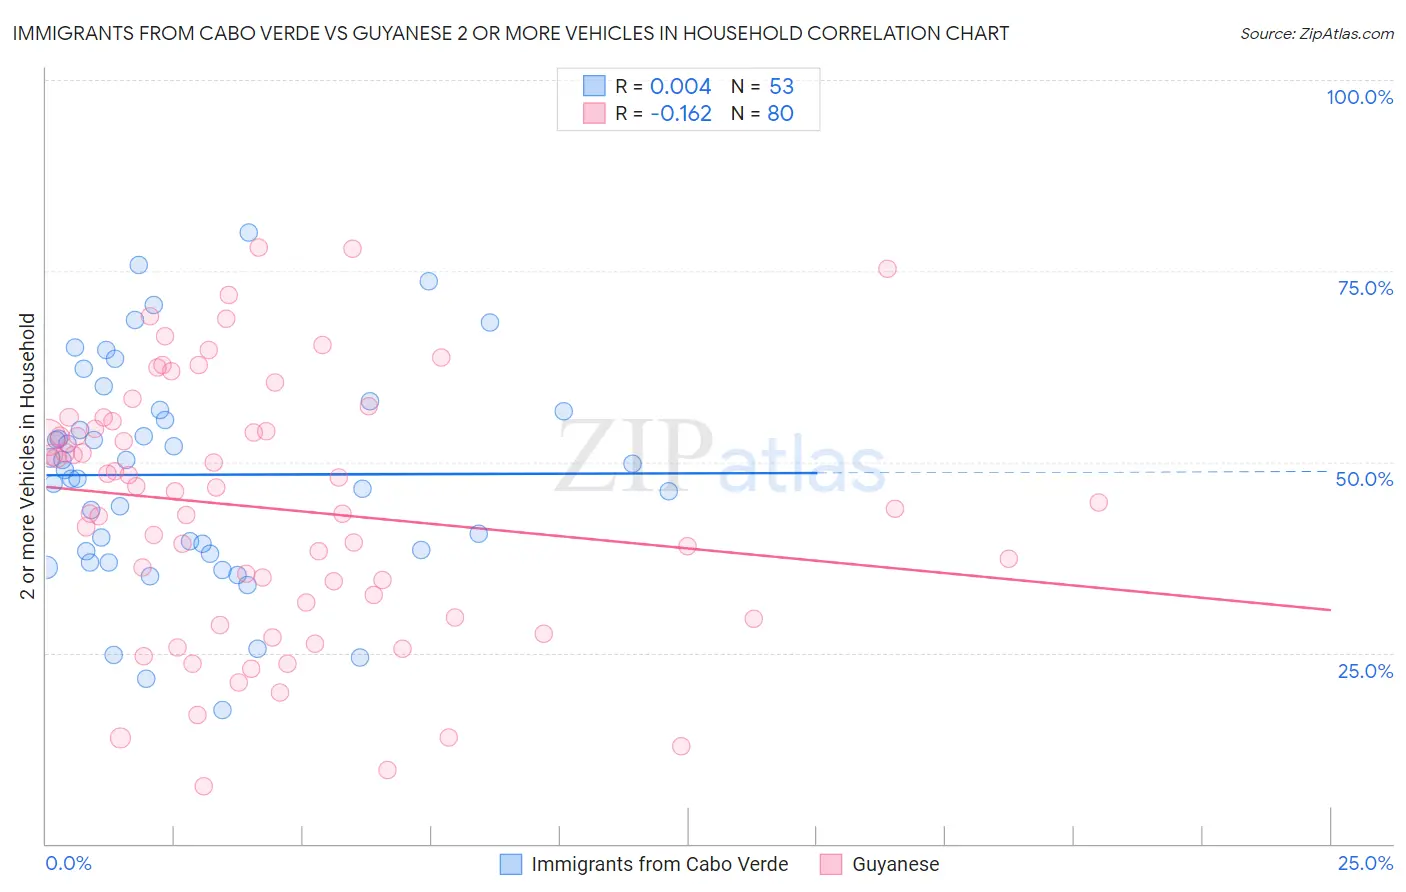
Immigrants from Cabo Verde vs Guyanese 2 or more Vehicles in Household Correlation Chart
The statistical analysis conducted on geographies consisting of 38,145,332 people shows no correlation between the proportion of Immigrants from Cabo Verde and percentage of households with 2 or more vehicles available in the United States with a correlation coefficient (R) of 0.004 and weighted average of 43.3%. Similarly, the statistical analysis conducted on geographies consisting of 176,820,378 people shows a poor negative correlation between the proportion of Guyanese and percentage of households with 2 or more vehicles available in the United States with a correlation coefficient (R) of -0.162 and weighted average of 35.4%, a difference of 22.5%.
2 or more Vehicles in Household Correlation Summary
| Measurement | Immigrants from Cabo Verde | Guyanese |
| Minimum | 17.5% | 7.4% |
| Maximum | 80.1% | 78.1% |
| Range | 62.6% | 70.6% |
| Mean | 48.3% | 43.9% |
| Median | 48.9% | 45.4% |
| Interquartile 25% (IQ1) | 38.1% | 30.7% |
| Interquartile 75% (IQ3) | 56.7% | 54.8% |
| Interquartile Range (IQR) | 18.6% | 24.2% |
| Standard Deviation (Sample) | 14.1% | 16.8% |
| Standard Deviation (Population) | 14.0% | 16.7% |
Demographics Similar to Immigrants from Cabo Verde and Guyanese by 2 or more Vehicles in Household
In terms of 2 or more vehicles in household, the demographic groups most similar to Immigrants from Cabo Verde are Immigrants from West Indies (43.1%, a difference of 0.57%), Immigrants from Senegal (43.0%, a difference of 0.72%), Immigrants from Yemen (42.8%, a difference of 1.1%), Inupiat (42.6%, a difference of 1.6%), and Immigrants from Caribbean (44.2%, a difference of 2.1%). Similarly, the demographic groups most similar to Guyanese are British West Indian (35.4%, a difference of 0.070%), Dominican (35.3%, a difference of 0.18%), Immigrants from Barbados (35.8%, a difference of 1.1%), Immigrants from Uzbekistan (37.9%, a difference of 7.1%), and Barbadian (38.3%, a difference of 8.4%).
| Demographics | Rating | Rank | 2 or more Vehicles in Household |
| Senegalese | 0.0 /100 | #322 | Tragic 44.2% |
| Immigrants | Caribbean | 0.0 /100 | #323 | Tragic 44.2% |
| Immigrants | Cabo Verde | 0.0 /100 | #324 | Tragic 43.3% |
| Immigrants | West Indies | 0.0 /100 | #325 | Tragic 43.1% |
| Immigrants | Senegal | 0.0 /100 | #326 | Tragic 43.0% |
| Immigrants | Yemen | 0.0 /100 | #327 | Tragic 42.8% |
| Inupiat | 0.0 /100 | #328 | Tragic 42.6% |
| Ecuadorians | 0.0 /100 | #329 | Tragic 42.0% |
| Immigrants | Dominica | 0.0 /100 | #330 | Tragic 41.6% |
| West Indians | 0.0 /100 | #331 | Tragic 41.3% |
| Trinidadians and Tobagonians | 0.0 /100 | #332 | Tragic 40.9% |
| Immigrants | Ecuador | 0.0 /100 | #333 | Tragic 40.5% |
| Immigrants | Trinidad and Tobago | 0.0 /100 | #334 | Tragic 40.3% |
| Immigrants | Bangladesh | 0.0 /100 | #335 | Tragic 38.8% |
| Vietnamese | 0.0 /100 | #336 | Tragic 38.5% |
| Barbadians | 0.0 /100 | #337 | Tragic 38.3% |
| Immigrants | Uzbekistan | 0.0 /100 | #338 | Tragic 37.9% |
| Immigrants | Barbados | 0.0 /100 | #339 | Tragic 35.8% |
| British West Indians | 0.0 /100 | #340 | Tragic 35.4% |
| Guyanese | 0.0 /100 | #341 | Tragic 35.4% |
| Dominicans | 0.0 /100 | #342 | Tragic 35.3% |