Immigrants from Cabo Verde vs Immigrants from Israel 2 or more Vehicles in Household
COMPARE
Immigrants from Cabo Verde
Immigrants from Israel
2 or more Vehicles in Household
2 or more Vehicles in Household Comparison
Immigrants from Cabo Verde
Immigrants from Israel
43.3%
2 OR MORE VEHICLES IN HOUSEHOLD
0.0/ 100
METRIC RATING
324th/ 347
METRIC RANK
49.2%
2 OR MORE VEHICLES IN HOUSEHOLD
0.0/ 100
METRIC RATING
306th/ 347
METRIC RANK
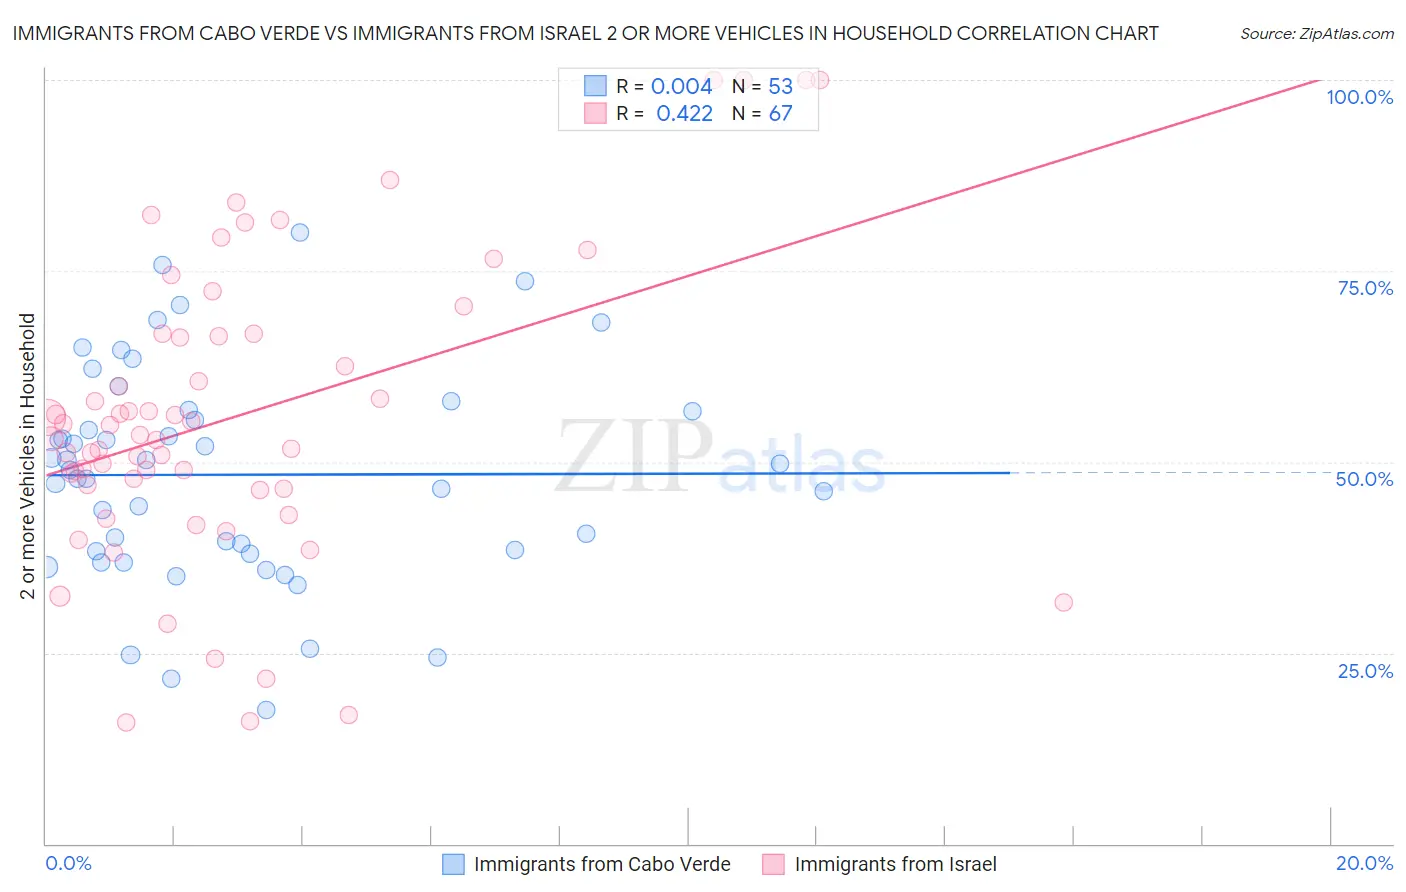
Immigrants from Cabo Verde vs Immigrants from Israel 2 or more Vehicles in Household Correlation Chart
The statistical analysis conducted on geographies consisting of 38,145,332 people shows no correlation between the proportion of Immigrants from Cabo Verde and percentage of households with 2 or more vehicles available in the United States with a correlation coefficient (R) of 0.004 and weighted average of 43.3%. Similarly, the statistical analysis conducted on geographies consisting of 209,979,242 people shows a moderate positive correlation between the proportion of Immigrants from Israel and percentage of households with 2 or more vehicles available in the United States with a correlation coefficient (R) of 0.422 and weighted average of 49.2%, a difference of 13.6%.
2 or more Vehicles in Household Correlation Summary
| Measurement | Immigrants from Cabo Verde | Immigrants from Israel |
| Minimum | 17.5% | 15.9% |
| Maximum | 80.1% | 100.0% |
| Range | 62.6% | 84.1% |
| Mean | 48.3% | 56.1% |
| Median | 48.9% | 53.6% |
| Interquartile 25% (IQ1) | 38.1% | 46.4% |
| Interquartile 75% (IQ3) | 56.7% | 66.7% |
| Interquartile Range (IQR) | 18.6% | 20.3% |
| Standard Deviation (Sample) | 14.1% | 19.7% |
| Standard Deviation (Population) | 14.0% | 19.5% |
Demographics Similar to Immigrants from Cabo Verde and Immigrants from Israel by 2 or more Vehicles in Household
In terms of 2 or more vehicles in household, the demographic groups most similar to Immigrants from Cabo Verde are Immigrants from West Indies (43.1%, a difference of 0.57%), Immigrants from Caribbean (44.2%, a difference of 2.1%), Senegalese (44.2%, a difference of 2.1%), Immigrants from Jamaica (44.5%, a difference of 2.6%), and Soviet Union (45.7%, a difference of 5.6%). Similarly, the demographic groups most similar to Immigrants from Israel are Immigrants from Western Africa (49.4%, a difference of 0.26%), Hopi (49.0%, a difference of 0.43%), Albanian (49.0%, a difference of 0.50%), Moroccan (48.8%, a difference of 0.85%), and Ghanaian (48.0%, a difference of 2.6%).
| Demographics | Rating | Rank | 2 or more Vehicles in Household |
| Immigrants | Western Africa | 0.0 /100 | #305 | Tragic 49.4% |
| Immigrants | Israel | 0.0 /100 | #306 | Tragic 49.2% |
| Hopi | 0.0 /100 | #307 | Tragic 49.0% |
| Albanians | 0.0 /100 | #308 | Tragic 49.0% |
| Moroccans | 0.0 /100 | #309 | Tragic 48.8% |
| Ghanaians | 0.0 /100 | #310 | Tragic 48.0% |
| Immigrants | Belarus | 0.0 /100 | #311 | Tragic 47.9% |
| Haitians | 0.0 /100 | #312 | Tragic 47.6% |
| U.S. Virgin Islanders | 0.0 /100 | #313 | Tragic 47.5% |
| Immigrants | Ghana | 0.0 /100 | #314 | Tragic 47.4% |
| Puerto Ricans | 0.0 /100 | #315 | Tragic 47.1% |
| Cape Verdeans | 0.0 /100 | #316 | Tragic 46.8% |
| Immigrants | Haiti | 0.0 /100 | #317 | Tragic 46.5% |
| Immigrants | Albania | 0.0 /100 | #318 | Tragic 46.0% |
| Jamaicans | 0.0 /100 | #319 | Tragic 45.8% |
| Soviet Union | 0.0 /100 | #320 | Tragic 45.7% |
| Immigrants | Jamaica | 0.0 /100 | #321 | Tragic 44.5% |
| Senegalese | 0.0 /100 | #322 | Tragic 44.2% |
| Immigrants | Caribbean | 0.0 /100 | #323 | Tragic 44.2% |
| Immigrants | Cabo Verde | 0.0 /100 | #324 | Tragic 43.3% |
| Immigrants | West Indies | 0.0 /100 | #325 | Tragic 43.1% |