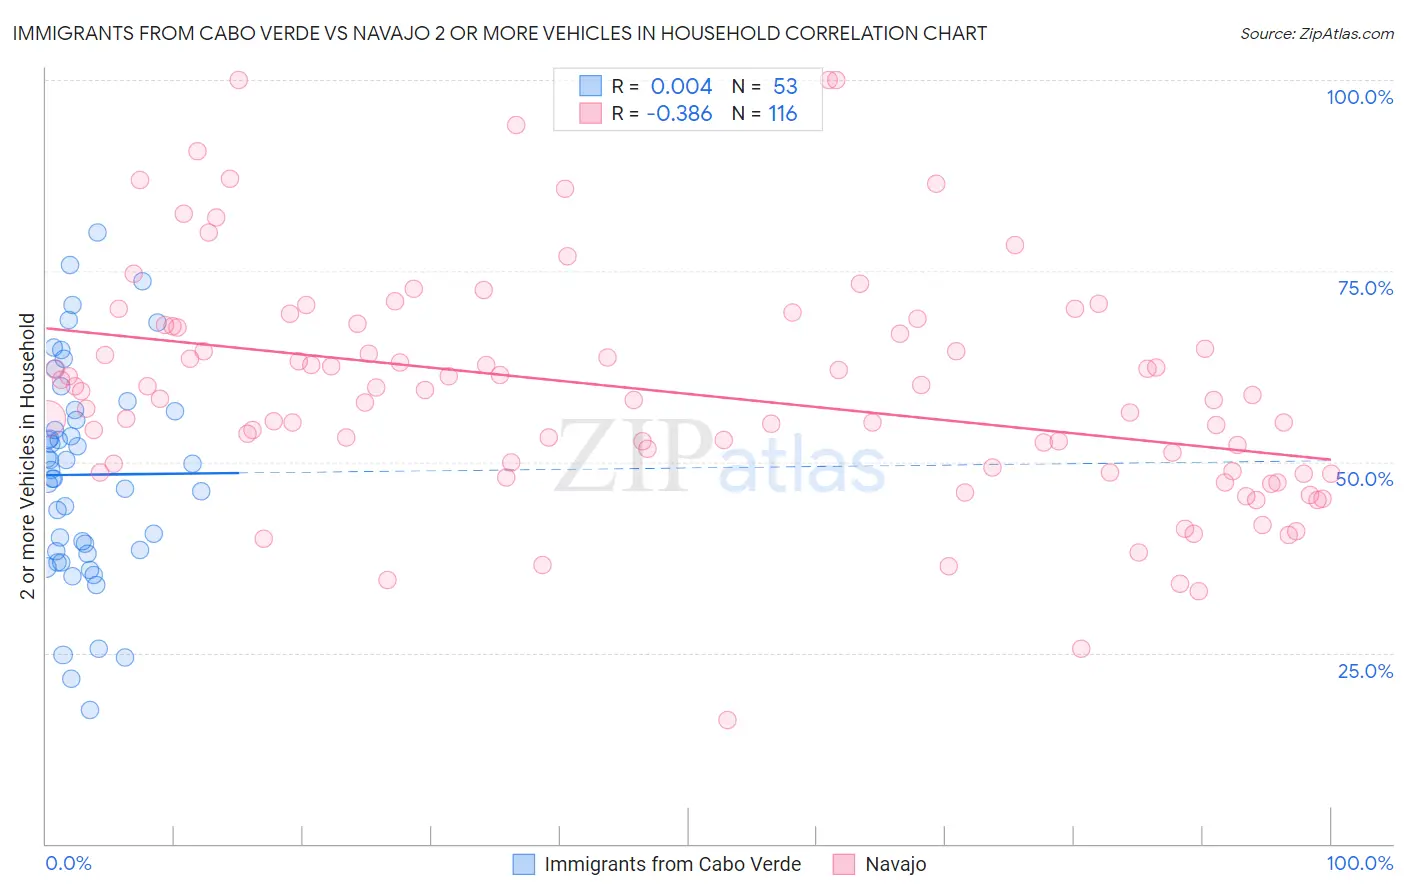
Immigrants from Cabo Verde vs Navajo 2 or more Vehicles in Household
COMPARE
Immigrants from Cabo Verde
Navajo
2 or more Vehicles in Household
2 or more Vehicles in Household Comparison
Immigrants from Cabo Verde
Navajo
43.3%
2 OR MORE VEHICLES IN HOUSEHOLD
0.0/ 100
METRIC RATING
324th/ 347
METRIC RANK
55.3%
2 OR MORE VEHICLES IN HOUSEHOLD
50.0/ 100
METRIC RATING
174th/ 347
METRIC RANK
Immigrants from Cabo Verde vs Navajo 2 or more Vehicles in Household Correlation Chart
The statistical analysis conducted on geographies consisting of 38,145,332 people shows no correlation between the proportion of Immigrants from Cabo Verde and percentage of households with 2 or more vehicles available in the United States with a correlation coefficient (R) of 0.004 and weighted average of 43.3%. Similarly, the statistical analysis conducted on geographies consisting of 224,763,782 people shows a mild negative correlation between the proportion of Navajo and percentage of households with 2 or more vehicles available in the United States with a correlation coefficient (R) of -0.386 and weighted average of 55.3%, a difference of 27.7%.
2 or more Vehicles in Household Correlation Summary
| Measurement | Immigrants from Cabo Verde | Navajo |
| Minimum | 17.5% | 16.3% |
| Maximum | 80.1% | 100.0% |
| Range | 62.6% | 83.7% |
| Mean | 48.3% | 59.2% |
| Median | 48.9% | 58.5% |
| Interquartile 25% (IQ1) | 38.1% | 49.0% |
| Interquartile 75% (IQ3) | 56.7% | 67.7% |
| Interquartile Range (IQR) | 18.6% | 18.7% |
| Standard Deviation (Sample) | 14.1% | 15.1% |
| Standard Deviation (Population) | 14.0% | 15.1% |
Similar Demographics by 2 or more Vehicles in Household
Demographics Similar to Immigrants from Cabo Verde by 2 or more Vehicles in Household
In terms of 2 or more vehicles in household, the demographic groups most similar to Immigrants from Cabo Verde are Immigrants from West Indies (43.1%, a difference of 0.57%), Immigrants from Senegal (43.0%, a difference of 0.72%), Immigrants from Yemen (42.8%, a difference of 1.1%), Inupiat (42.6%, a difference of 1.6%), and Immigrants from Caribbean (44.2%, a difference of 2.1%).
| Demographics | Rating | Rank | 2 or more Vehicles in Household |
| Immigrants | Haiti | 0.0 /100 | #317 | Tragic 46.5% |
| Immigrants | Albania | 0.0 /100 | #318 | Tragic 46.0% |
| Jamaicans | 0.0 /100 | #319 | Tragic 45.8% |
| Soviet Union | 0.0 /100 | #320 | Tragic 45.7% |
| Immigrants | Jamaica | 0.0 /100 | #321 | Tragic 44.5% |
| Senegalese | 0.0 /100 | #322 | Tragic 44.2% |
| Immigrants | Caribbean | 0.0 /100 | #323 | Tragic 44.2% |
| Immigrants | Cabo Verde | 0.0 /100 | #324 | Tragic 43.3% |
| Immigrants | West Indies | 0.0 /100 | #325 | Tragic 43.1% |
| Immigrants | Senegal | 0.0 /100 | #326 | Tragic 43.0% |
| Immigrants | Yemen | 0.0 /100 | #327 | Tragic 42.8% |
| Inupiat | 0.0 /100 | #328 | Tragic 42.6% |
| Ecuadorians | 0.0 /100 | #329 | Tragic 42.0% |
| Immigrants | Dominica | 0.0 /100 | #330 | Tragic 41.6% |
| West Indians | 0.0 /100 | #331 | Tragic 41.3% |
Demographics Similar to Navajo by 2 or more Vehicles in Household
In terms of 2 or more vehicles in household, the demographic groups most similar to Navajo are Immigrants from Denmark (55.3%, a difference of 0.020%), Immigrants from Western Europe (55.4%, a difference of 0.050%), Immigrants from Nicaragua (55.4%, a difference of 0.070%), Immigrants from Cuba (55.3%, a difference of 0.12%), and Menominee (55.3%, a difference of 0.15%).
| Demographics | Rating | Rank | 2 or more Vehicles in Household |
| Kenyans | 58.1 /100 | #167 | Average 55.5% |
| French American Indians | 56.7 /100 | #168 | Average 55.5% |
| Immigrants | Austria | 56.3 /100 | #169 | Average 55.5% |
| Romanians | 55.8 /100 | #170 | Average 55.5% |
| Immigrants | Costa Rica | 54.4 /100 | #171 | Average 55.4% |
| Immigrants | Nicaragua | 51.6 /100 | #172 | Average 55.4% |
| Immigrants | Western Europe | 51.4 /100 | #173 | Average 55.4% |
| Navajo | 50.0 /100 | #174 | Average 55.3% |
| Immigrants | Denmark | 49.4 /100 | #175 | Average 55.3% |
| Immigrants | Cuba | 47.0 /100 | #176 | Average 55.3% |
| Menominee | 46.2 /100 | #177 | Average 55.3% |
| Immigrants | Sweden | 45.3 /100 | #178 | Average 55.2% |
| Alaskan Athabascans | 42.9 /100 | #179 | Average 55.2% |
| Immigrants | Kenya | 40.4 /100 | #180 | Average 55.1% |
| Immigrants | Micronesia | 38.2 /100 | #181 | Fair 55.1% |