Immigrants from Bulgaria vs Samoan Male Unemployment
COMPARE
Immigrants from Bulgaria
Samoan
Male Unemployment
Male Unemployment Comparison
Immigrants from Bulgaria
Samoans
5.0%
MALE UNEMPLOYMENT
98.7/ 100
METRIC RATING
56th/ 347
METRIC RANK
5.5%
MALE UNEMPLOYMENT
4.9/ 100
METRIC RATING
215th/ 347
METRIC RANK
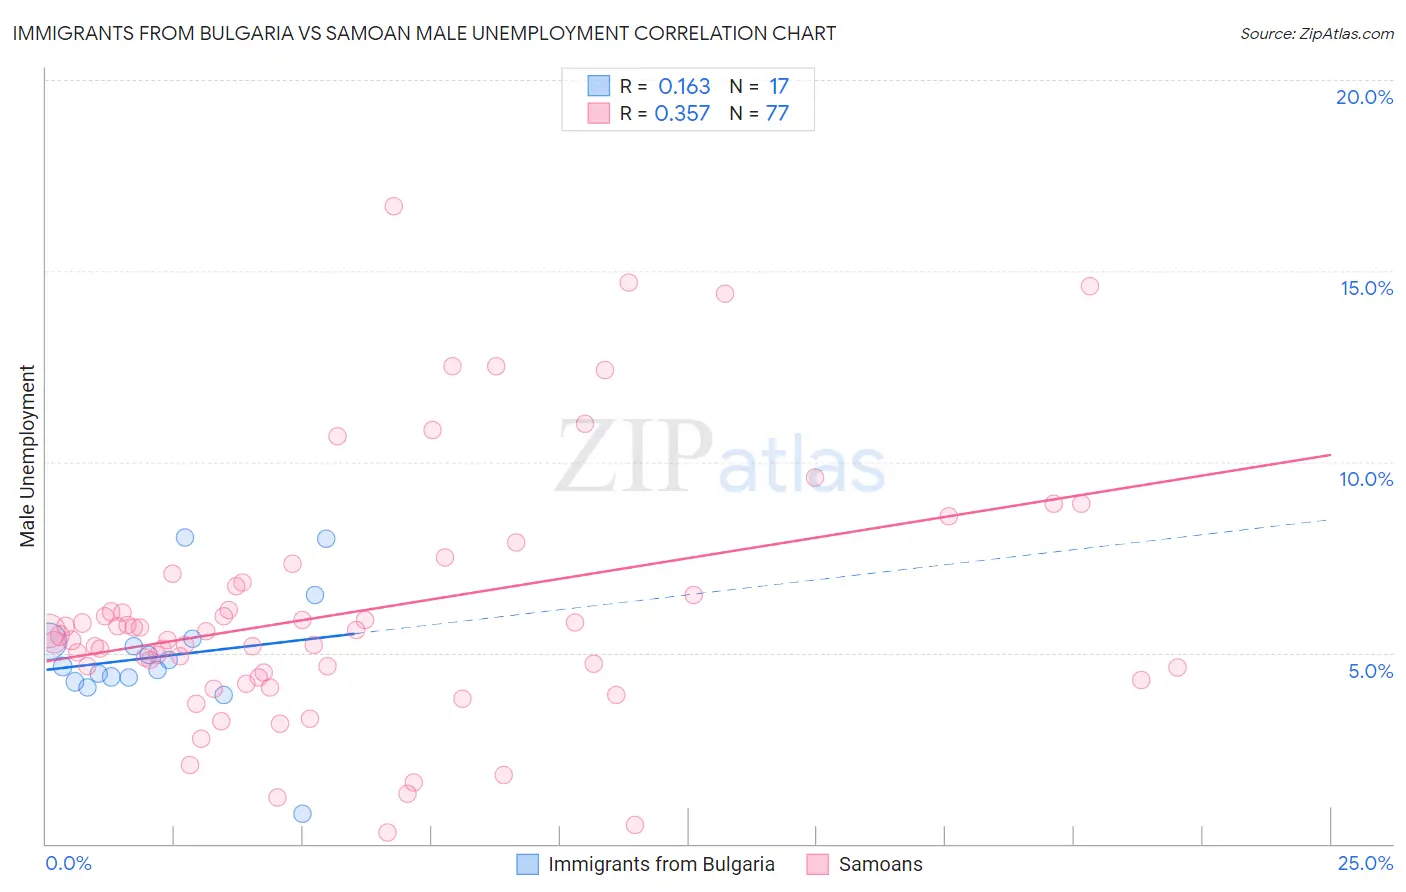
Immigrants from Bulgaria vs Samoan Male Unemployment Correlation Chart
The statistical analysis conducted on geographies consisting of 172,373,504 people shows a poor positive correlation between the proportion of Immigrants from Bulgaria and unemployment rate among males in the United States with a correlation coefficient (R) of 0.163 and weighted average of 5.0%. Similarly, the statistical analysis conducted on geographies consisting of 224,577,965 people shows a mild positive correlation between the proportion of Samoans and unemployment rate among males in the United States with a correlation coefficient (R) of 0.357 and weighted average of 5.5%, a difference of 11.4%.
Male Unemployment Correlation Summary
| Measurement | Immigrants from Bulgaria | Samoan |
| Minimum | 0.80% | 0.30% |
| Maximum | 8.0% | 16.7% |
| Range | 7.2% | 16.4% |
| Mean | 4.9% | 6.1% |
| Median | 4.6% | 5.5% |
| Interquartile 25% (IQ1) | 4.3% | 4.4% |
| Interquartile 75% (IQ3) | 5.3% | 6.8% |
| Interquartile Range (IQR) | 1.0% | 2.4% |
| Standard Deviation (Sample) | 1.6% | 3.3% |
| Standard Deviation (Population) | 1.6% | 3.3% |
Similar Demographics by Male Unemployment
Demographics Similar to Immigrants from Bulgaria by Male Unemployment
In terms of male unemployment, the demographic groups most similar to Immigrants from Bulgaria are Czechoslovakian (5.0%, a difference of 0.0%), Yugoslavian (5.0%, a difference of 0.010%), Jordanian (5.0%, a difference of 0.11%), Irish (5.0%, a difference of 0.17%), and Slovene (5.0%, a difference of 0.19%).
| Demographics | Rating | Rank | Male Unemployment |
| Poles | 98.9 /100 | #49 | Exceptional 4.9% |
| Croatians | 98.9 /100 | #50 | Exceptional 4.9% |
| Slovenes | 98.8 /100 | #51 | Exceptional 5.0% |
| Irish | 98.8 /100 | #52 | Exceptional 5.0% |
| Jordanians | 98.8 /100 | #53 | Exceptional 5.0% |
| Yugoslavians | 98.7 /100 | #54 | Exceptional 5.0% |
| Czechoslovakians | 98.7 /100 | #55 | Exceptional 5.0% |
| Immigrants | Bulgaria | 98.7 /100 | #56 | Exceptional 5.0% |
| Turks | 98.5 /100 | #57 | Exceptional 5.0% |
| Lithuanians | 98.5 /100 | #58 | Exceptional 5.0% |
| Immigrants | Netherlands | 98.3 /100 | #59 | Exceptional 5.0% |
| Immigrants | Argentina | 98.1 /100 | #60 | Exceptional 5.0% |
| Cambodians | 98.1 /100 | #61 | Exceptional 5.0% |
| Basques | 97.9 /100 | #62 | Exceptional 5.0% |
| Eastern Europeans | 97.9 /100 | #63 | Exceptional 5.0% |
Demographics Similar to Samoans by Male Unemployment
In terms of male unemployment, the demographic groups most similar to Samoans are Immigrants (5.5%, a difference of 0.17%), Puget Sound Salish (5.5%, a difference of 0.20%), Delaware (5.5%, a difference of 0.22%), Ugandan (5.5%, a difference of 0.37%), and Immigrants from Albania (5.5%, a difference of 0.43%).
| Demographics | Rating | Rank | Male Unemployment |
| Immigrants | Lebanon | 8.6 /100 | #208 | Tragic 5.5% |
| Immigrants | Middle Africa | 8.3 /100 | #209 | Tragic 5.5% |
| South American Indians | 7.6 /100 | #210 | Tragic 5.5% |
| Israelis | 7.4 /100 | #211 | Tragic 5.5% |
| Hmong | 7.0 /100 | #212 | Tragic 5.5% |
| Ugandans | 6.3 /100 | #213 | Tragic 5.5% |
| Puget Sound Salish | 5.6 /100 | #214 | Tragic 5.5% |
| Samoans | 4.9 /100 | #215 | Tragic 5.5% |
| Immigrants | Immigrants | 4.3 /100 | #216 | Tragic 5.5% |
| Delaware | 4.2 /100 | #217 | Tragic 5.5% |
| Immigrants | Albania | 3.6 /100 | #218 | Tragic 5.5% |
| Immigrants | Western Asia | 3.5 /100 | #219 | Tragic 5.6% |
| Portuguese | 3.5 /100 | #220 | Tragic 5.6% |
| Soviet Union | 3.2 /100 | #221 | Tragic 5.6% |
| Immigrants | Micronesia | 2.9 /100 | #222 | Tragic 5.6% |