Immigrants from Bulgaria vs Samoan Disability Age 35 to 64
COMPARE
Immigrants from Bulgaria
Samoan
Disability Age 35 to 64
Disability Age 35 to 64 Comparison
Immigrants from Bulgaria
Samoans
9.8%
DISABILITY AGE 35 TO 64
99.8/ 100
METRIC RATING
52nd/ 347
METRIC RANK
12.1%
DISABILITY AGE 35 TO 64
2.8/ 100
METRIC RATING
242nd/ 347
METRIC RANK
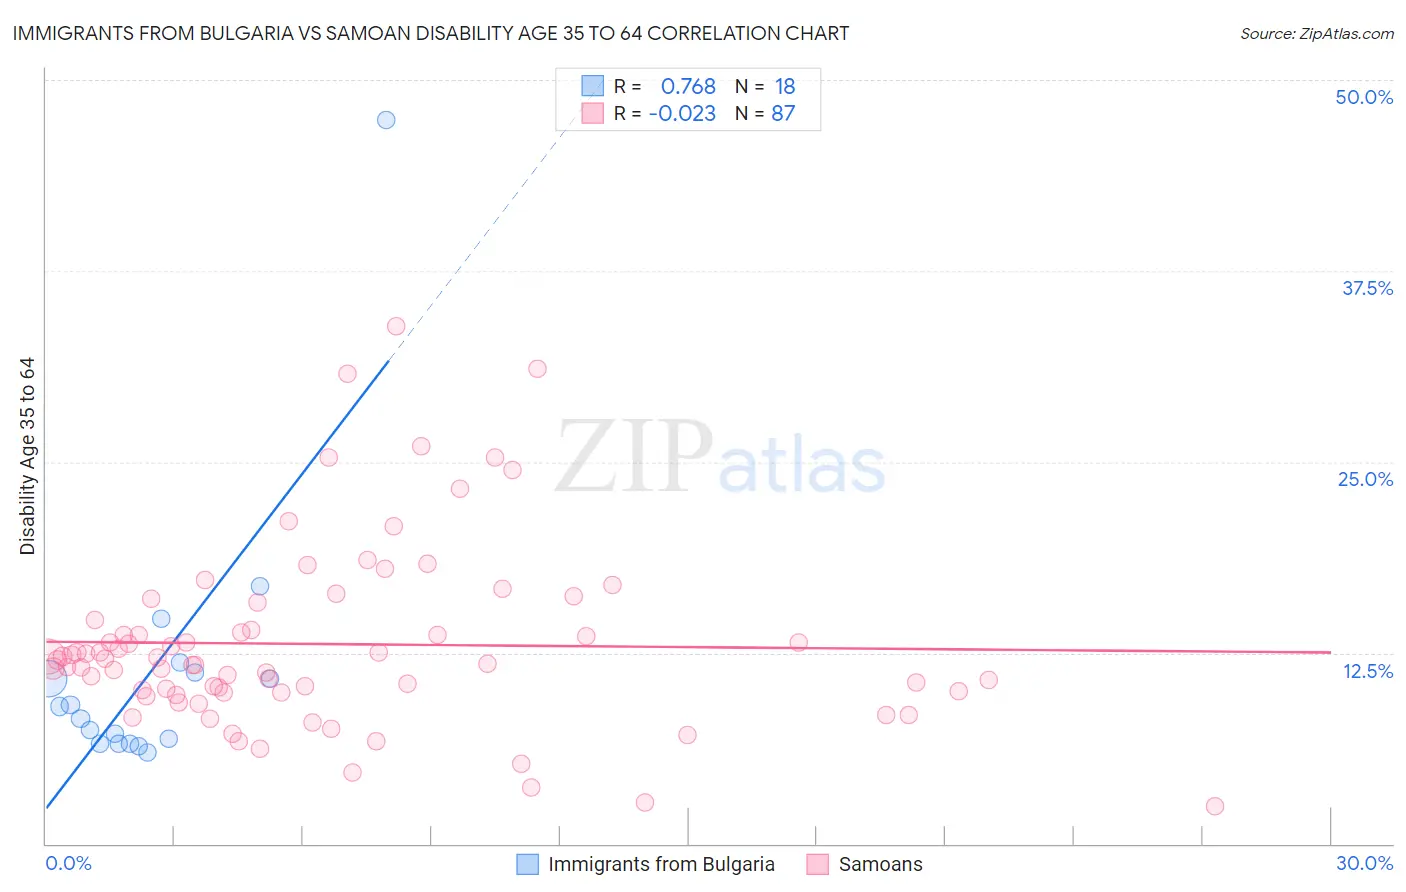
Immigrants from Bulgaria vs Samoan Disability Age 35 to 64 Correlation Chart
The statistical analysis conducted on geographies consisting of 172,533,865 people shows a strong positive correlation between the proportion of Immigrants from Bulgaria and percentage of population with a disability between the ages 34 and 64 in the United States with a correlation coefficient (R) of 0.768 and weighted average of 9.8%. Similarly, the statistical analysis conducted on geographies consisting of 225,063,493 people shows no correlation between the proportion of Samoans and percentage of population with a disability between the ages 34 and 64 in the United States with a correlation coefficient (R) of -0.023 and weighted average of 12.1%, a difference of 22.7%.
Disability Age 35 to 64 Correlation Summary
| Measurement | Immigrants from Bulgaria | Samoan |
| Minimum | 5.9% | 2.4% |
| Maximum | 47.4% | 33.9% |
| Range | 41.4% | 31.4% |
| Mean | 11.3% | 13.1% |
| Median | 8.6% | 12.0% |
| Interquartile 25% (IQ1) | 6.5% | 9.9% |
| Interquartile 75% (IQ3) | 11.2% | 14.6% |
| Interquartile Range (IQR) | 4.7% | 4.7% |
| Standard Deviation (Sample) | 9.5% | 6.0% |
| Standard Deviation (Population) | 9.2% | 5.9% |
Similar Demographics by Disability Age 35 to 64
Demographics Similar to Immigrants from Bulgaria by Disability Age 35 to 64
In terms of disability age 35 to 64, the demographic groups most similar to Immigrants from Bulgaria are Bhutanese (9.8%, a difference of 0.010%), Taiwanese (9.8%, a difference of 0.060%), Immigrants from Russia (9.8%, a difference of 0.090%), Paraguayan (9.8%, a difference of 0.10%), and Peruvian (9.9%, a difference of 0.16%).
| Demographics | Rating | Rank | Disability Age 35 to 64 |
| Immigrants | Peru | 99.9 /100 | #45 | Exceptional 9.8% |
| Cambodians | 99.8 /100 | #46 | Exceptional 9.8% |
| Immigrants | Belgium | 99.8 /100 | #47 | Exceptional 9.8% |
| Immigrants | Serbia | 99.8 /100 | #48 | Exceptional 9.8% |
| Immigrants | Greece | 99.8 /100 | #49 | Exceptional 9.8% |
| Paraguayans | 99.8 /100 | #50 | Exceptional 9.8% |
| Bhutanese | 99.8 /100 | #51 | Exceptional 9.8% |
| Immigrants | Bulgaria | 99.8 /100 | #52 | Exceptional 9.8% |
| Taiwanese | 99.8 /100 | #53 | Exceptional 9.8% |
| Immigrants | Russia | 99.8 /100 | #54 | Exceptional 9.8% |
| Peruvians | 99.8 /100 | #55 | Exceptional 9.9% |
| South Americans | 99.8 /100 | #56 | Exceptional 9.9% |
| Colombians | 99.8 /100 | #57 | Exceptional 9.9% |
| Armenians | 99.8 /100 | #58 | Exceptional 9.9% |
| Immigrants | Sweden | 99.7 /100 | #59 | Exceptional 9.9% |
Demographics Similar to Samoans by Disability Age 35 to 64
In terms of disability age 35 to 64, the demographic groups most similar to Samoans are Slovak (12.1%, a difference of 0.10%), Mexican American Indian (12.0%, a difference of 0.27%), Immigrants from Western Africa (12.0%, a difference of 0.30%), Immigrants from Thailand (12.0%, a difference of 0.30%), and Finnish (12.1%, a difference of 0.36%).
| Demographics | Rating | Rank | Disability Age 35 to 64 |
| Belizeans | 4.5 /100 | #235 | Tragic 12.0% |
| Immigrants | Middle Africa | 4.5 /100 | #236 | Tragic 12.0% |
| Immigrants | Cambodia | 3.9 /100 | #237 | Tragic 12.0% |
| West Indians | 3.7 /100 | #238 | Tragic 12.0% |
| Immigrants | Western Africa | 3.3 /100 | #239 | Tragic 12.0% |
| Immigrants | Thailand | 3.3 /100 | #240 | Tragic 12.0% |
| Mexican American Indians | 3.2 /100 | #241 | Tragic 12.0% |
| Samoans | 2.8 /100 | #242 | Tragic 12.1% |
| Slovaks | 2.7 /100 | #243 | Tragic 12.1% |
| Finns | 2.3 /100 | #244 | Tragic 12.1% |
| Immigrants | Mexico | 2.2 /100 | #245 | Tragic 12.1% |
| Guamanians/Chamorros | 1.4 /100 | #246 | Tragic 12.2% |
| Immigrants | Senegal | 1.3 /100 | #247 | Tragic 12.2% |
| Spaniards | 1.3 /100 | #248 | Tragic 12.3% |
| Hispanics or Latinos | 1.3 /100 | #249 | Tragic 12.3% |