Immigrants from Belarus vs Immigrants from Micronesia Single Mother Poverty
COMPARE
Immigrants from Belarus
Immigrants from Micronesia
Single Mother Poverty
Single Mother Poverty Comparison
Immigrants from Belarus
Immigrants from Micronesia
27.4%
SINGLE MOTHER POVERTY
99.4/ 100
METRIC RATING
70th/ 347
METRIC RANK
31.6%
SINGLE MOTHER POVERTY
0.1/ 100
METRIC RATING
272nd/ 347
METRIC RANK
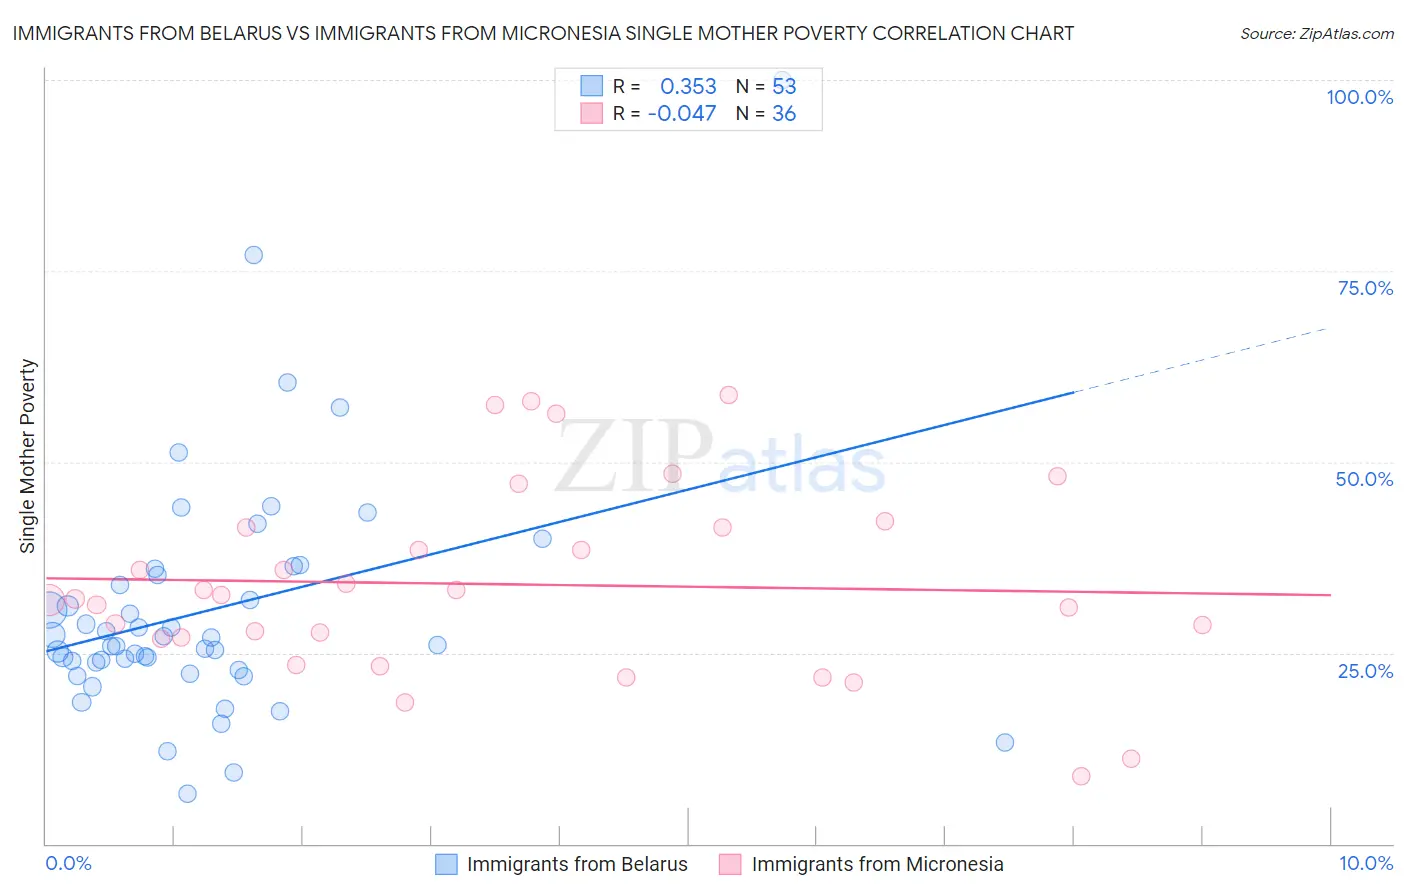
Immigrants from Belarus vs Immigrants from Micronesia Single Mother Poverty Correlation Chart
The statistical analysis conducted on geographies consisting of 148,206,459 people shows a mild positive correlation between the proportion of Immigrants from Belarus and poverty level among single mothers in the United States with a correlation coefficient (R) of 0.353 and weighted average of 27.4%. Similarly, the statistical analysis conducted on geographies consisting of 61,413,620 people shows no correlation between the proportion of Immigrants from Micronesia and poverty level among single mothers in the United States with a correlation coefficient (R) of -0.047 and weighted average of 31.6%, a difference of 15.2%.
Single Mother Poverty Correlation Summary
| Measurement | Immigrants from Belarus | Immigrants from Micronesia |
| Minimum | 6.6% | 8.8% |
| Maximum | 100.0% | 58.8% |
| Range | 93.4% | 50.0% |
| Mean | 30.6% | 34.0% |
| Median | 26.1% | 32.3% |
| Interquartile 25% (IQ1) | 23.2% | 26.9% |
| Interquartile 75% (IQ3) | 35.6% | 41.3% |
| Interquartile Range (IQR) | 12.4% | 14.5% |
| Standard Deviation (Sample) | 15.9% | 12.4% |
| Standard Deviation (Population) | 15.8% | 12.2% |
Similar Demographics by Single Mother Poverty
Demographics Similar to Immigrants from Belarus by Single Mother Poverty
In terms of single mother poverty, the demographic groups most similar to Immigrants from Belarus are Lithuanian (27.4%, a difference of 0.010%), Macedonian (27.4%, a difference of 0.020%), Immigrants from Russia (27.4%, a difference of 0.040%), Sierra Leonean (27.4%, a difference of 0.11%), and Immigrants from Czechoslovakia (27.4%, a difference of 0.17%).
| Demographics | Rating | Rank | Single Mother Poverty |
| Immigrants | Northern Europe | 99.5 /100 | #63 | Exceptional 27.3% |
| Russians | 99.5 /100 | #64 | Exceptional 27.3% |
| Immigrants | Turkey | 99.5 /100 | #65 | Exceptional 27.3% |
| Soviet Union | 99.5 /100 | #66 | Exceptional 27.3% |
| Immigrants | Australia | 99.5 /100 | #67 | Exceptional 27.3% |
| Immigrants | Czechoslovakia | 99.5 /100 | #68 | Exceptional 27.4% |
| Lithuanians | 99.4 /100 | #69 | Exceptional 27.4% |
| Immigrants | Belarus | 99.4 /100 | #70 | Exceptional 27.4% |
| Macedonians | 99.4 /100 | #71 | Exceptional 27.4% |
| Immigrants | Russia | 99.4 /100 | #72 | Exceptional 27.4% |
| Sierra Leoneans | 99.3 /100 | #73 | Exceptional 27.4% |
| Immigrants | Europe | 99.3 /100 | #74 | Exceptional 27.4% |
| Immigrants | Sweden | 99.2 /100 | #75 | Exceptional 27.5% |
| Peruvians | 99.2 /100 | #76 | Exceptional 27.5% |
| Immigrants | Peru | 99.2 /100 | #77 | Exceptional 27.5% |
Demographics Similar to Immigrants from Micronesia by Single Mother Poverty
In terms of single mother poverty, the demographic groups most similar to Immigrants from Micronesia are Immigrants from Cabo Verde (31.6%, a difference of 0.010%), Fijian (31.6%, a difference of 0.23%), British West Indian (31.5%, a difference of 0.26%), Scotch-Irish (31.5%, a difference of 0.30%), and Immigrants from Senegal (31.5%, a difference of 0.35%).
| Demographics | Rating | Rank | Single Mother Poverty |
| German Russians | 0.2 /100 | #265 | Tragic 31.3% |
| Sub-Saharan Africans | 0.2 /100 | #266 | Tragic 31.4% |
| Immigrants | Belize | 0.2 /100 | #267 | Tragic 31.4% |
| Immigrants | Senegal | 0.1 /100 | #268 | Tragic 31.5% |
| Scotch-Irish | 0.1 /100 | #269 | Tragic 31.5% |
| British West Indians | 0.1 /100 | #270 | Tragic 31.5% |
| Immigrants | Cabo Verde | 0.1 /100 | #271 | Tragic 31.6% |
| Immigrants | Micronesia | 0.1 /100 | #272 | Tragic 31.6% |
| Fijians | 0.1 /100 | #273 | Tragic 31.6% |
| Bangladeshis | 0.1 /100 | #274 | Tragic 31.7% |
| Central Americans | 0.1 /100 | #275 | Tragic 31.8% |
| Delaware | 0.0 /100 | #276 | Tragic 31.8% |
| Mexican American Indians | 0.0 /100 | #277 | Tragic 31.9% |
| Immigrants | Zaire | 0.0 /100 | #278 | Tragic 32.0% |
| Marshallese | 0.0 /100 | #279 | Tragic 32.1% |