Nicaraguan vs Immigrants from Bulgaria 3 or more Vehicles in Household
COMPARE
Nicaraguan
Immigrants from Bulgaria
3 or more Vehicles in Household
3 or more Vehicles in Household Comparison
Nicaraguans
Immigrants from Bulgaria
20.7%
3 OR MORE VEHICLES IN HOUSEHOLD
96.2/ 100
METRIC RATING
112th/ 347
METRIC RANK
17.7%
3 OR MORE VEHICLES IN HOUSEHOLD
0.8/ 100
METRIC RATING
268th/ 347
METRIC RANK
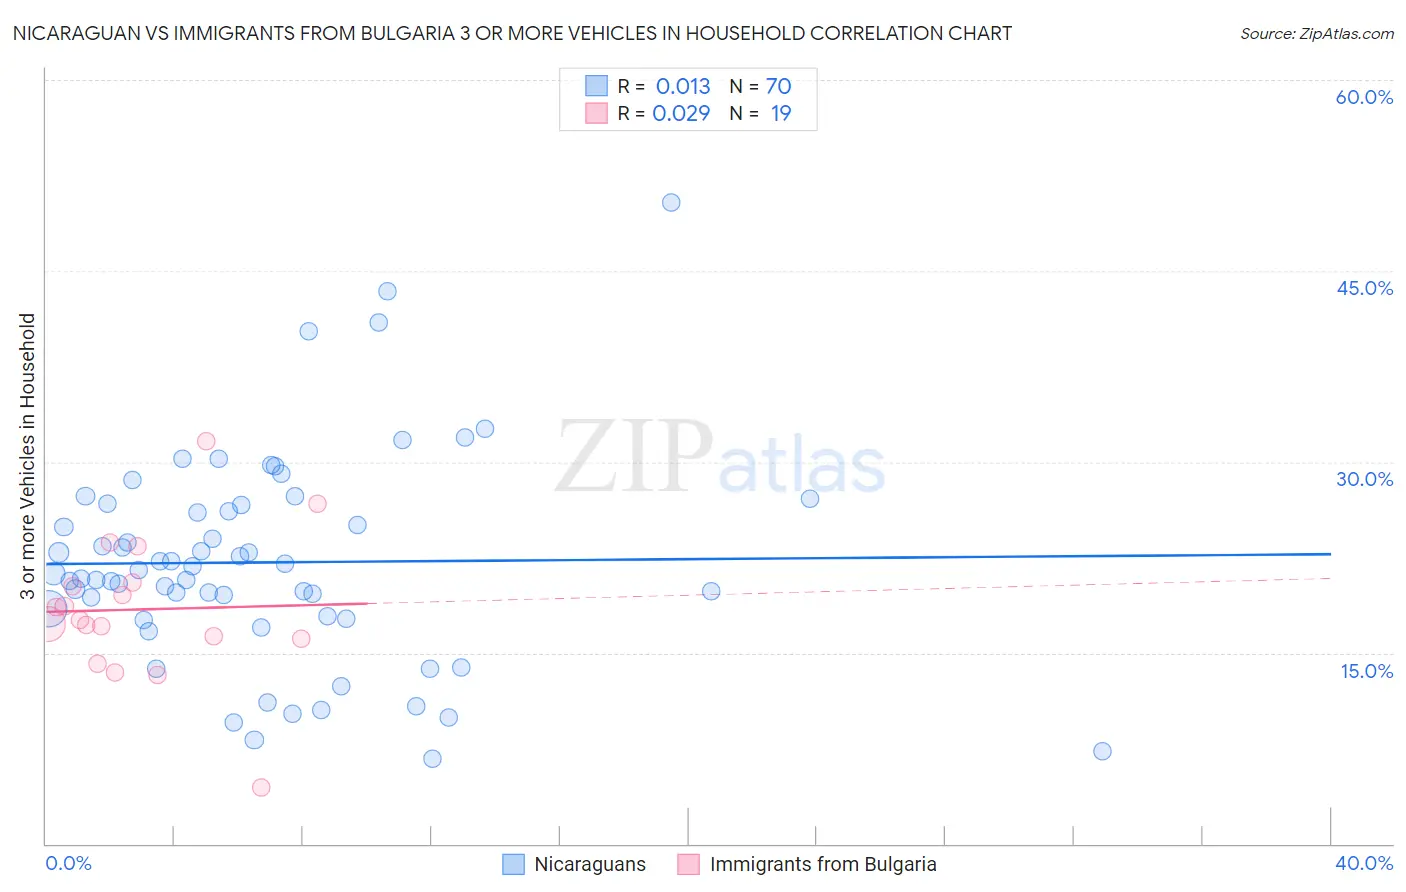
Nicaraguan vs Immigrants from Bulgaria 3 or more Vehicles in Household Correlation Chart
The statistical analysis conducted on geographies consisting of 285,540,553 people shows no correlation between the proportion of Nicaraguans and percentage of households with 3 or more vehicles available in the United States with a correlation coefficient (R) of 0.013 and weighted average of 20.7%. Similarly, the statistical analysis conducted on geographies consisting of 172,519,366 people shows no correlation between the proportion of Immigrants from Bulgaria and percentage of households with 3 or more vehicles available in the United States with a correlation coefficient (R) of 0.029 and weighted average of 17.7%, a difference of 16.8%.
3 or more Vehicles in Household Correlation Summary
| Measurement | Nicaraguan | Immigrants from Bulgaria |
| Minimum | 6.6% | 4.4% |
| Maximum | 50.3% | 31.6% |
| Range | 43.7% | 27.3% |
| Mean | 22.1% | 18.4% |
| Median | 21.4% | 17.6% |
| Interquartile 25% (IQ1) | 17.9% | 16.1% |
| Interquartile 75% (IQ3) | 26.6% | 20.5% |
| Interquartile Range (IQR) | 8.7% | 4.4% |
| Standard Deviation (Sample) | 8.3% | 5.7% |
| Standard Deviation (Population) | 8.2% | 5.5% |
Similar Demographics by 3 or more Vehicles in Household
Demographics Similar to Nicaraguans by 3 or more Vehicles in Household
In terms of 3 or more vehicles in household, the demographic groups most similar to Nicaraguans are Immigrants from England (20.7%, a difference of 0.010%), Burmese (20.6%, a difference of 0.19%), Immigrants from Micronesia (20.7%, a difference of 0.29%), Asian (20.8%, a difference of 0.32%), and Filipino (20.8%, a difference of 0.46%).
| Demographics | Rating | Rank | 3 or more Vehicles in Household |
| Austrians | 97.5 /100 | #105 | Exceptional 20.9% |
| Bolivians | 97.4 /100 | #106 | Exceptional 20.8% |
| Immigrants | Germany | 97.4 /100 | #107 | Exceptional 20.8% |
| Immigrants | Scotland | 97.1 /100 | #108 | Exceptional 20.8% |
| Filipinos | 97.0 /100 | #109 | Exceptional 20.8% |
| Asians | 96.8 /100 | #110 | Exceptional 20.8% |
| Immigrants | Micronesia | 96.7 /100 | #111 | Exceptional 20.7% |
| Nicaraguans | 96.2 /100 | #112 | Exceptional 20.7% |
| Immigrants | England | 96.2 /100 | #113 | Exceptional 20.7% |
| Burmese | 95.8 /100 | #114 | Exceptional 20.6% |
| French Canadians | 95.0 /100 | #115 | Exceptional 20.6% |
| Italians | 94.9 /100 | #116 | Exceptional 20.6% |
| Croatians | 94.9 /100 | #117 | Exceptional 20.6% |
| Costa Ricans | 94.6 /100 | #118 | Exceptional 20.6% |
| Immigrants | Latin America | 94.5 /100 | #119 | Exceptional 20.5% |
Demographics Similar to Immigrants from Bulgaria by 3 or more Vehicles in Household
In terms of 3 or more vehicles in household, the demographic groups most similar to Immigrants from Bulgaria are Immigrants from Venezuela (17.7%, a difference of 0.010%), Macedonian (17.7%, a difference of 0.070%), Immigrants from Panama (17.7%, a difference of 0.090%), Cambodian (17.8%, a difference of 0.23%), and Bermudan (17.8%, a difference of 0.26%).
| Demographics | Rating | Rank | 3 or more Vehicles in Household |
| Immigrants | Northern Africa | 0.9 /100 | #261 | Tragic 17.8% |
| Colombians | 0.9 /100 | #262 | Tragic 17.8% |
| Bermudans | 0.9 /100 | #263 | Tragic 17.8% |
| Cambodians | 0.9 /100 | #264 | Tragic 17.8% |
| Immigrants | Panama | 0.8 /100 | #265 | Tragic 17.7% |
| Macedonians | 0.8 /100 | #266 | Tragic 17.7% |
| Immigrants | Venezuela | 0.8 /100 | #267 | Tragic 17.7% |
| Immigrants | Bulgaria | 0.8 /100 | #268 | Tragic 17.7% |
| Immigrants | France | 0.6 /100 | #269 | Tragic 17.6% |
| Immigrants | Nepal | 0.6 /100 | #270 | Tragic 17.6% |
| South Americans | 0.6 /100 | #271 | Tragic 17.6% |
| Immigrants | Africa | 0.5 /100 | #272 | Tragic 17.6% |
| Immigrants | Sudan | 0.5 /100 | #273 | Tragic 17.6% |
| Immigrants | Bosnia and Herzegovina | 0.5 /100 | #274 | Tragic 17.5% |
| Immigrants | Ukraine | 0.4 /100 | #275 | Tragic 17.5% |