Immigrants from Australia vs Brazilian Single Father Poverty
COMPARE
Immigrants from Australia
Brazilian
Single Father Poverty
Single Father Poverty Comparison
Immigrants from Australia
Brazilians
15.7%
SINGLE FATHER POVERTY
96.1/ 100
METRIC RATING
105th/ 347
METRIC RANK
15.5%
SINGLE FATHER POVERTY
99.0/ 100
METRIC RATING
87th/ 347
METRIC RANK
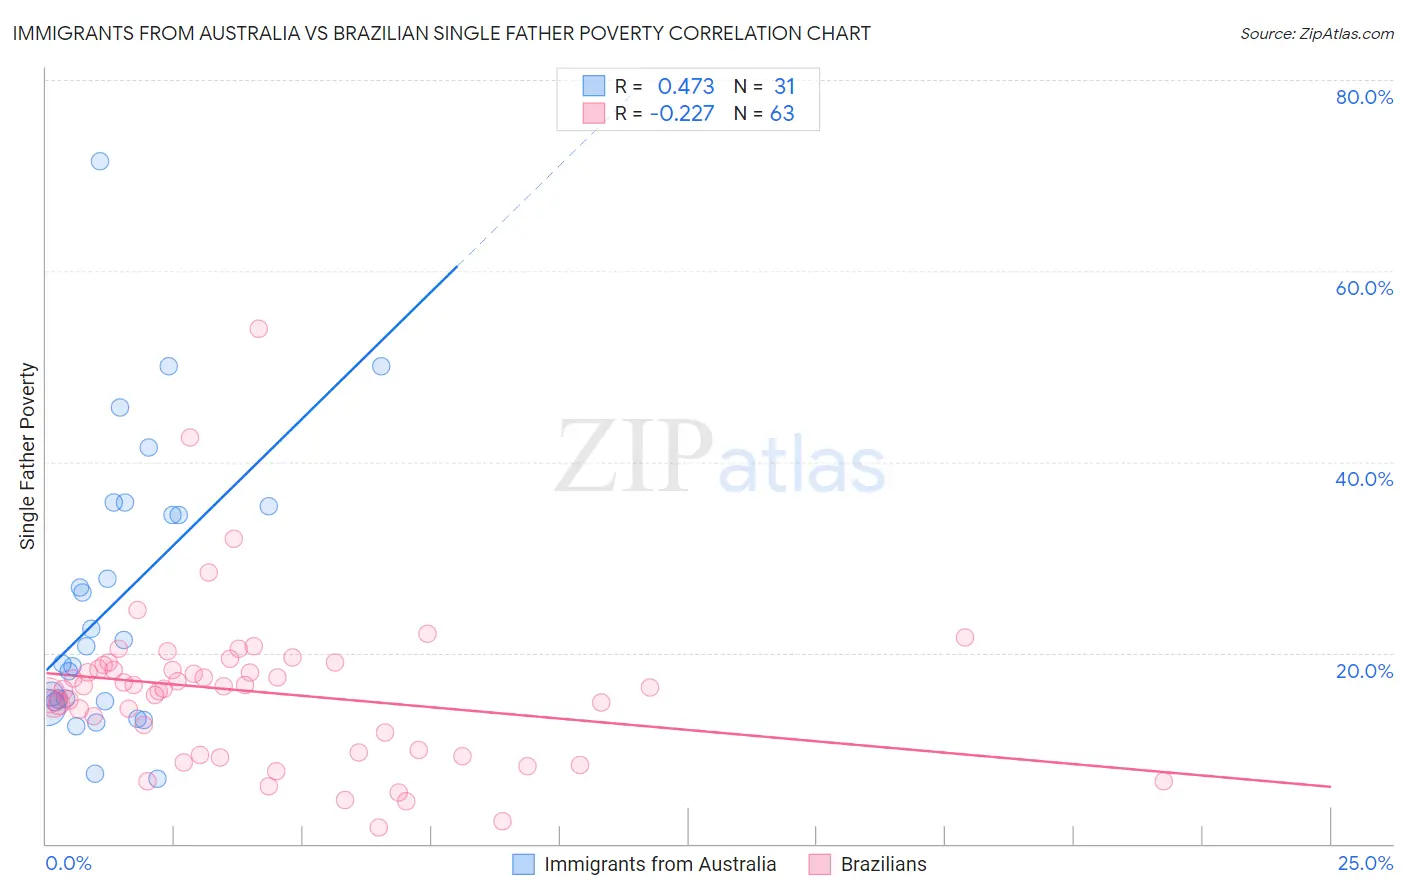
Immigrants from Australia vs Brazilian Single Father Poverty Correlation Chart
The statistical analysis conducted on geographies consisting of 187,295,963 people shows a moderate positive correlation between the proportion of Immigrants from Australia and poverty level among single fathers in the United States with a correlation coefficient (R) of 0.473 and weighted average of 15.7%. Similarly, the statistical analysis conducted on geographies consisting of 259,661,498 people shows a weak negative correlation between the proportion of Brazilians and poverty level among single fathers in the United States with a correlation coefficient (R) of -0.227 and weighted average of 15.5%, a difference of 1.7%.
Single Father Poverty Correlation Summary
| Measurement | Immigrants from Australia | Brazilian |
| Minimum | 6.8% | 1.7% |
| Maximum | 71.5% | 53.9% |
| Range | 64.7% | 52.2% |
| Mean | 25.5% | 15.9% |
| Median | 20.7% | 16.4% |
| Interquartile 25% (IQ1) | 14.9% | 9.6% |
| Interquartile 75% (IQ3) | 35.3% | 18.7% |
| Interquartile Range (IQR) | 20.4% | 9.1% |
| Standard Deviation (Sample) | 14.9% | 8.4% |
| Standard Deviation (Population) | 14.6% | 8.4% |
Demographics Similar to Immigrants from Australia and Brazilians by Single Father Poverty
In terms of single father poverty, the demographic groups most similar to Immigrants from Australia are Australian (15.7%, a difference of 0.010%), South American Indian (15.7%, a difference of 0.030%), Immigrants from Poland (15.7%, a difference of 0.070%), Chilean (15.7%, a difference of 0.10%), and Fijian (15.7%, a difference of 0.25%). Similarly, the demographic groups most similar to Brazilians are Immigrants from Russia (15.5%, a difference of 0.0%), Burmese (15.5%, a difference of 0.030%), Immigrants from Korea (15.5%, a difference of 0.090%), Mexican American Indian (15.5%, a difference of 0.33%), and Immigrants from Romania (15.5%, a difference of 0.43%).
| Demographics | Rating | Rank | Single Father Poverty |
| Immigrants | Russia | 99.0 /100 | #86 | Exceptional 15.5% |
| Brazilians | 99.0 /100 | #87 | Exceptional 15.5% |
| Burmese | 99.0 /100 | #88 | Exceptional 15.5% |
| Immigrants | Korea | 99.0 /100 | #89 | Exceptional 15.5% |
| Mexican American Indians | 98.7 /100 | #90 | Exceptional 15.5% |
| Immigrants | Romania | 98.6 /100 | #91 | Exceptional 15.5% |
| Immigrants | Serbia | 98.5 /100 | #92 | Exceptional 15.5% |
| Basques | 98.4 /100 | #93 | Exceptional 15.5% |
| Immigrants | Uruguay | 98.2 /100 | #94 | Exceptional 15.6% |
| Immigrants | Kazakhstan | 98.2 /100 | #95 | Exceptional 15.6% |
| Immigrants | Belgium | 98.1 /100 | #96 | Exceptional 15.6% |
| Yaqui | 98.1 /100 | #97 | Exceptional 15.6% |
| Zimbabweans | 98.1 /100 | #98 | Exceptional 15.6% |
| Immigrants | Middle Africa | 97.4 /100 | #99 | Exceptional 15.6% |
| Immigrants | Chile | 96.9 /100 | #100 | Exceptional 15.7% |
| Fijians | 96.8 /100 | #101 | Exceptional 15.7% |
| Chileans | 96.4 /100 | #102 | Exceptional 15.7% |
| South American Indians | 96.2 /100 | #103 | Exceptional 15.7% |
| Australians | 96.1 /100 | #104 | Exceptional 15.7% |
| Immigrants | Australia | 96.1 /100 | #105 | Exceptional 15.7% |
| Immigrants | Poland | 95.8 /100 | #106 | Exceptional 15.7% |