Immigrants from Asia vs Pakistani Child Poverty Among Boys Under 16
COMPARE
Immigrants from Asia
Pakistani
Child Poverty Among Boys Under 16
Child Poverty Among Boys Under 16 Comparison
Immigrants from Asia
Pakistanis
13.9%
CHILD POVERTY AMONG BOYS UNDER 16
99.6/ 100
METRIC RATING
40th/ 347
METRIC RANK
15.1%
CHILD POVERTY AMONG BOYS UNDER 16
94.7/ 100
METRIC RATING
109th/ 347
METRIC RANK
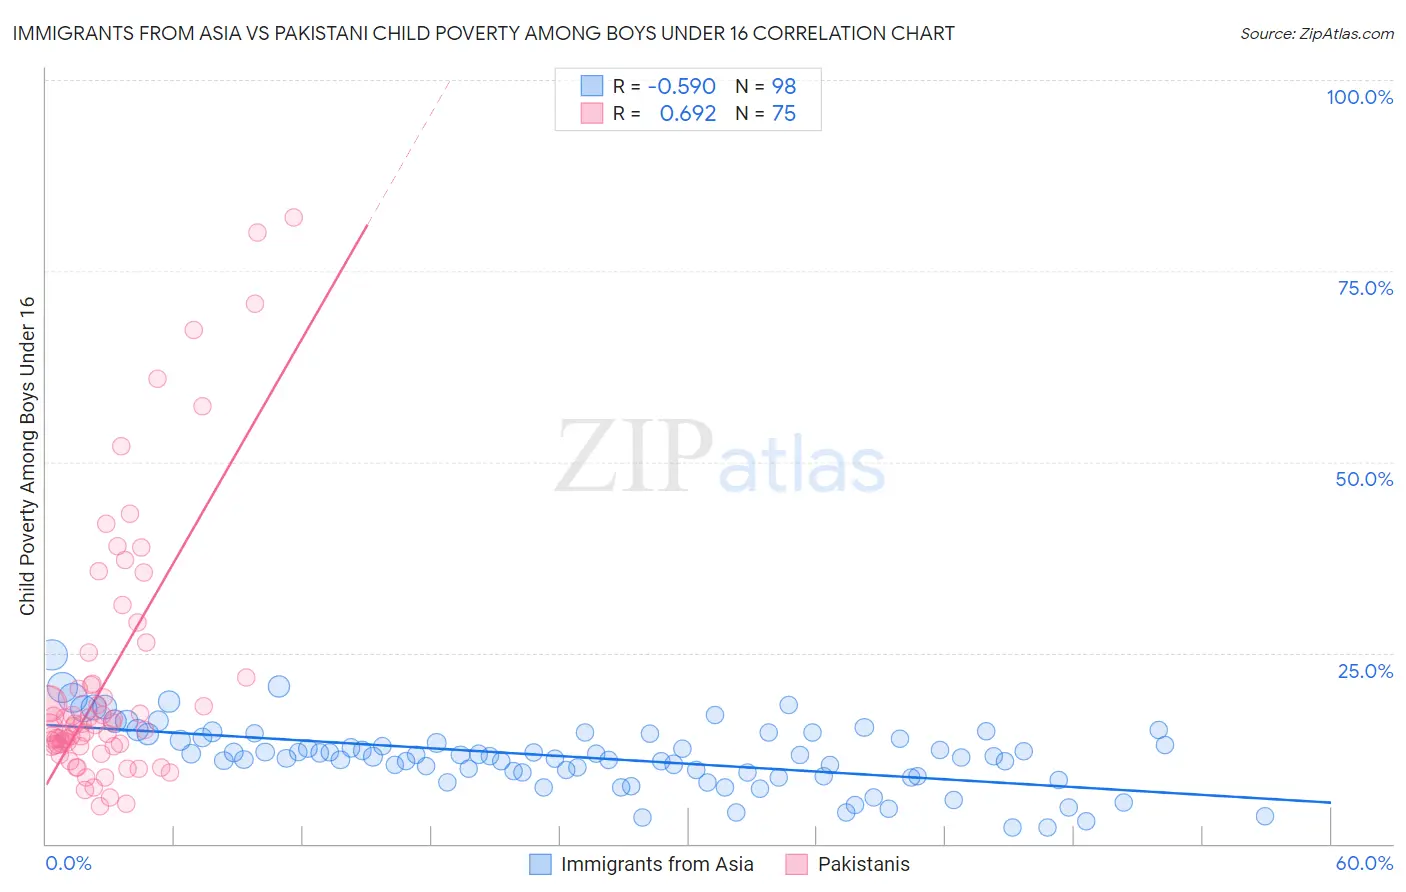
Immigrants from Asia vs Pakistani Child Poverty Among Boys Under 16 Correlation Chart
The statistical analysis conducted on geographies consisting of 532,124,226 people shows a substantial negative correlation between the proportion of Immigrants from Asia and poverty level among boys under the age of 16 in the United States with a correlation coefficient (R) of -0.590 and weighted average of 13.9%. Similarly, the statistical analysis conducted on geographies consisting of 331,571,147 people shows a significant positive correlation between the proportion of Pakistanis and poverty level among boys under the age of 16 in the United States with a correlation coefficient (R) of 0.692 and weighted average of 15.1%, a difference of 8.4%.
Child Poverty Among Boys Under 16 Correlation Summary
| Measurement | Immigrants from Asia | Pakistani |
| Minimum | 2.1% | 4.9% |
| Maximum | 24.7% | 82.1% |
| Range | 22.6% | 77.1% |
| Mean | 11.3% | 21.9% |
| Median | 11.4% | 15.5% |
| Interquartile 25% (IQ1) | 8.9% | 13.0% |
| Interquartile 75% (IQ3) | 14.0% | 21.7% |
| Interquartile Range (IQR) | 5.1% | 8.7% |
| Standard Deviation (Sample) | 4.2% | 17.2% |
| Standard Deviation (Population) | 4.2% | 17.1% |
Similar Demographics by Child Poverty Among Boys Under 16
Demographics Similar to Immigrants from Asia by Child Poverty Among Boys Under 16
In terms of child poverty among boys under 16, the demographic groups most similar to Immigrants from Asia are Lithuanian (14.0%, a difference of 0.090%), Korean (14.0%, a difference of 0.11%), Immigrants from Australia (13.9%, a difference of 0.24%), Immigrants from Northern Europe (13.9%, a difference of 0.38%), and Immigrants from Sri Lanka (13.9%, a difference of 0.53%).
| Demographics | Rating | Rank | Child Poverty Among Boys Under 16 |
| Danes | 99.8 /100 | #33 | Exceptional 13.6% |
| Assyrians/Chaldeans/Syriacs | 99.8 /100 | #34 | Exceptional 13.6% |
| Russians | 99.7 /100 | #35 | Exceptional 13.8% |
| Luxembourgers | 99.7 /100 | #36 | Exceptional 13.8% |
| Immigrants | Sri Lanka | 99.6 /100 | #37 | Exceptional 13.9% |
| Immigrants | Northern Europe | 99.6 /100 | #38 | Exceptional 13.9% |
| Immigrants | Australia | 99.6 /100 | #39 | Exceptional 13.9% |
| Immigrants | Asia | 99.6 /100 | #40 | Exceptional 13.9% |
| Lithuanians | 99.6 /100 | #41 | Exceptional 14.0% |
| Koreans | 99.6 /100 | #42 | Exceptional 14.0% |
| Croatians | 99.5 /100 | #43 | Exceptional 14.0% |
| Estonians | 99.4 /100 | #44 | Exceptional 14.1% |
| Immigrants | Scotland | 99.4 /100 | #45 | Exceptional 14.1% |
| Greeks | 99.4 /100 | #46 | Exceptional 14.1% |
| Immigrants | Moldova | 99.4 /100 | #47 | Exceptional 14.1% |
Demographics Similar to Pakistanis by Child Poverty Among Boys Under 16
In terms of child poverty among boys under 16, the demographic groups most similar to Pakistanis are Immigrants from England (15.1%, a difference of 0.040%), Jordanian (15.1%, a difference of 0.21%), English (15.1%, a difference of 0.26%), Immigrants from Zimbabwe (15.2%, a difference of 0.31%), and Serbian (15.1%, a difference of 0.32%).
| Demographics | Rating | Rank | Child Poverty Among Boys Under 16 |
| Romanians | 95.6 /100 | #102 | Exceptional 15.0% |
| Immigrants | Denmark | 95.6 /100 | #103 | Exceptional 15.0% |
| Immigrants | Switzerland | 95.4 /100 | #104 | Exceptional 15.0% |
| Dutch | 95.4 /100 | #105 | Exceptional 15.0% |
| Serbians | 95.2 /100 | #106 | Exceptional 15.1% |
| Jordanians | 95.1 /100 | #107 | Exceptional 15.1% |
| Immigrants | England | 94.8 /100 | #108 | Exceptional 15.1% |
| Pakistanis | 94.7 /100 | #109 | Exceptional 15.1% |
| English | 94.3 /100 | #110 | Exceptional 15.1% |
| Immigrants | Zimbabwe | 94.2 /100 | #111 | Exceptional 15.2% |
| Basques | 93.8 /100 | #112 | Exceptional 15.2% |
| Irish | 93.8 /100 | #113 | Exceptional 15.2% |
| Immigrants | Ukraine | 93.6 /100 | #114 | Exceptional 15.2% |
| Armenians | 93.6 /100 | #115 | Exceptional 15.2% |
| Immigrants | South Eastern Asia | 93.5 /100 | #116 | Exceptional 15.2% |