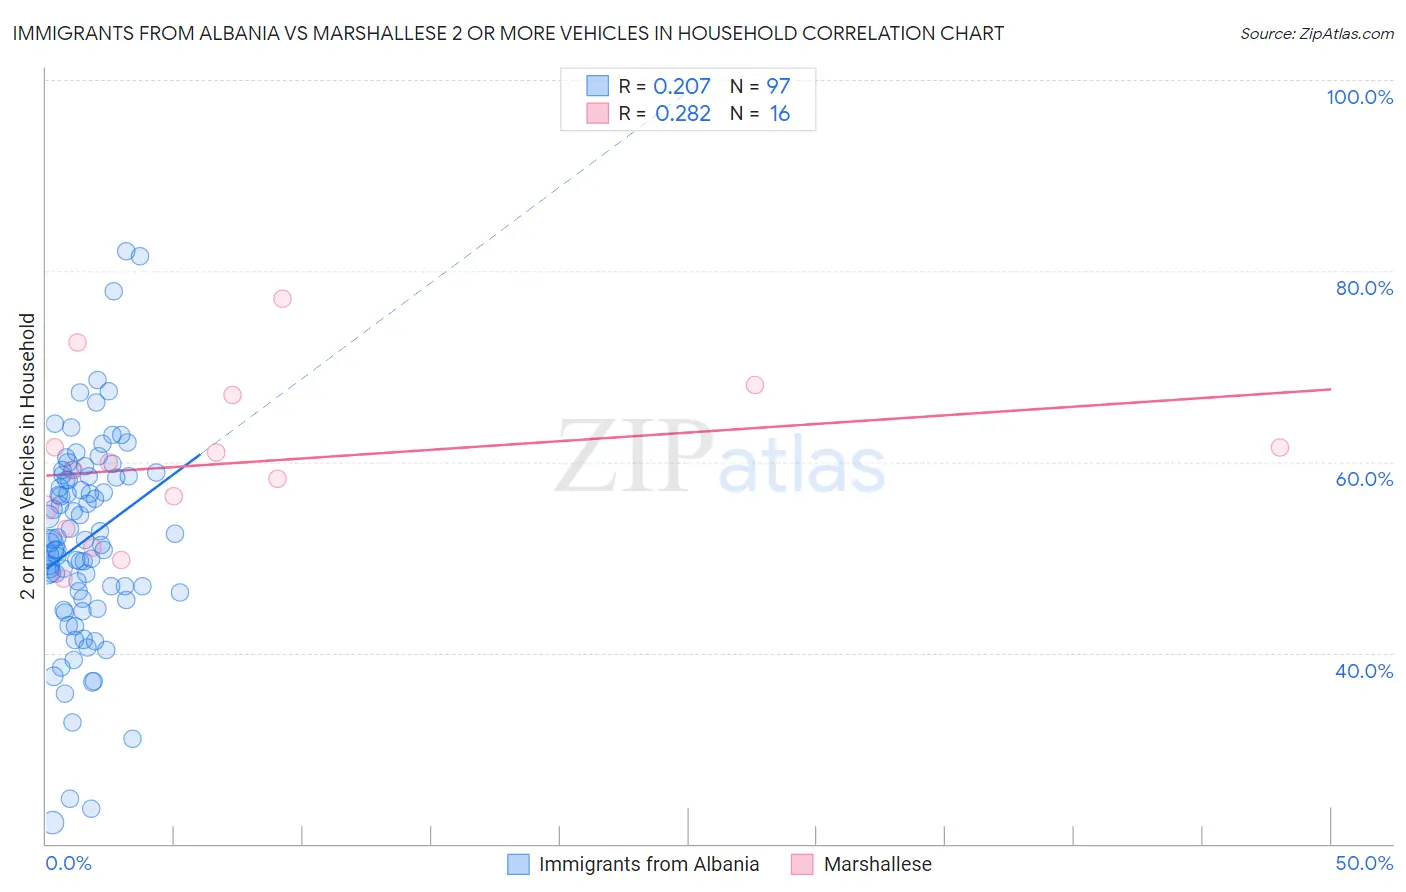
Immigrants from Albania vs Marshallese 2 or more Vehicles in Household
COMPARE
Immigrants from Albania
Marshallese
2 or more Vehicles in Household
2 or more Vehicles in Household Comparison
Immigrants from Albania
Marshallese
46.0%
2 OR MORE VEHICLES IN HOUSEHOLD
0.0/ 100
METRIC RATING
318th/ 347
METRIC RANK
54.9%
2 OR MORE VEHICLES IN HOUSEHOLD
30.5/ 100
METRIC RATING
188th/ 347
METRIC RANK
Immigrants from Albania vs Marshallese 2 or more Vehicles in Household Correlation Chart
The statistical analysis conducted on geographies consisting of 119,187,610 people shows a weak positive correlation between the proportion of Immigrants from Albania and percentage of households with 2 or more vehicles available in the United States with a correlation coefficient (R) of 0.207 and weighted average of 46.0%. Similarly, the statistical analysis conducted on geographies consisting of 14,761,315 people shows a weak positive correlation between the proportion of Marshallese and percentage of households with 2 or more vehicles available in the United States with a correlation coefficient (R) of 0.282 and weighted average of 54.9%, a difference of 19.3%.
2 or more Vehicles in Household Correlation Summary
| Measurement | Immigrants from Albania | Marshallese |
| Minimum | 22.2% | 47.8% |
| Maximum | 82.0% | 77.0% |
| Range | 59.8% | 29.3% |
| Mean | 51.7% | 60.0% |
| Median | 51.5% | 59.6% |
| Interquartile 25% (IQ1) | 46.0% | 54.1% |
| Interquartile 75% (IQ3) | 58.5% | 64.3% |
| Interquartile Range (IQR) | 12.5% | 10.2% |
| Standard Deviation (Sample) | 10.7% | 8.1% |
| Standard Deviation (Population) | 10.7% | 7.9% |
Similar Demographics by 2 or more Vehicles in Household
Demographics Similar to Immigrants from Albania by 2 or more Vehicles in Household
In terms of 2 or more vehicles in household, the demographic groups most similar to Immigrants from Albania are Jamaican (45.8%, a difference of 0.52%), Soviet Union (45.7%, a difference of 0.58%), Immigrants from Haiti (46.5%, a difference of 1.1%), Cape Verdean (46.8%, a difference of 1.7%), and Puerto Rican (47.1%, a difference of 2.4%).
| Demographics | Rating | Rank | 2 or more Vehicles in Household |
| Immigrants | Belarus | 0.0 /100 | #311 | Tragic 47.9% |
| Haitians | 0.0 /100 | #312 | Tragic 47.6% |
| U.S. Virgin Islanders | 0.0 /100 | #313 | Tragic 47.5% |
| Immigrants | Ghana | 0.0 /100 | #314 | Tragic 47.4% |
| Puerto Ricans | 0.0 /100 | #315 | Tragic 47.1% |
| Cape Verdeans | 0.0 /100 | #316 | Tragic 46.8% |
| Immigrants | Haiti | 0.0 /100 | #317 | Tragic 46.5% |
| Immigrants | Albania | 0.0 /100 | #318 | Tragic 46.0% |
| Jamaicans | 0.0 /100 | #319 | Tragic 45.8% |
| Soviet Union | 0.0 /100 | #320 | Tragic 45.7% |
| Immigrants | Jamaica | 0.0 /100 | #321 | Tragic 44.5% |
| Senegalese | 0.0 /100 | #322 | Tragic 44.2% |
| Immigrants | Caribbean | 0.0 /100 | #323 | Tragic 44.2% |
| Immigrants | Cabo Verde | 0.0 /100 | #324 | Tragic 43.3% |
| Immigrants | West Indies | 0.0 /100 | #325 | Tragic 43.1% |
Demographics Similar to Marshallese by 2 or more Vehicles in Household
In terms of 2 or more vehicles in household, the demographic groups most similar to Marshallese are Immigrants from Uganda (55.0%, a difference of 0.13%), Peruvian (55.0%, a difference of 0.15%), Eastern European (54.8%, a difference of 0.15%), Russian (54.8%, a difference of 0.21%), and Arab (55.0%, a difference of 0.24%).
| Demographics | Rating | Rank | 2 or more Vehicles in Household |
| Immigrants | Micronesia | 38.2 /100 | #181 | Fair 55.1% |
| Cree | 38.2 /100 | #182 | Fair 55.1% |
| Immigrants | Cameroon | 37.3 /100 | #183 | Fair 55.1% |
| Apache | 36.7 /100 | #184 | Fair 55.1% |
| Arabs | 35.9 /100 | #185 | Fair 55.0% |
| Peruvians | 33.7 /100 | #186 | Fair 55.0% |
| Immigrants | Uganda | 33.4 /100 | #187 | Fair 55.0% |
| Marshallese | 30.5 /100 | #188 | Fair 54.9% |
| Eastern Europeans | 27.5 /100 | #189 | Fair 54.8% |
| Russians | 26.3 /100 | #190 | Fair 54.8% |
| Immigrants | Immigrants | 25.0 /100 | #191 | Fair 54.7% |
| Immigrants | Romania | 23.8 /100 | #192 | Fair 54.7% |
| Immigrants | Japan | 23.4 /100 | #193 | Fair 54.7% |
| Central Americans | 23.0 /100 | #194 | Fair 54.7% |
| Iroquois | 22.6 /100 | #195 | Fair 54.7% |