Immigrants from Albania vs Italian 2 or more Vehicles in Household
COMPARE
Immigrants from Albania
Italian
2 or more Vehicles in Household
2 or more Vehicles in Household Comparison
Immigrants from Albania
Italians
46.0%
2 OR MORE VEHICLES IN HOUSEHOLD
0.0/ 100
METRIC RATING
318th/ 347
METRIC RANK
58.4%
2 OR MORE VEHICLES IN HOUSEHOLD
99.6/ 100
METRIC RATING
70th/ 347
METRIC RANK
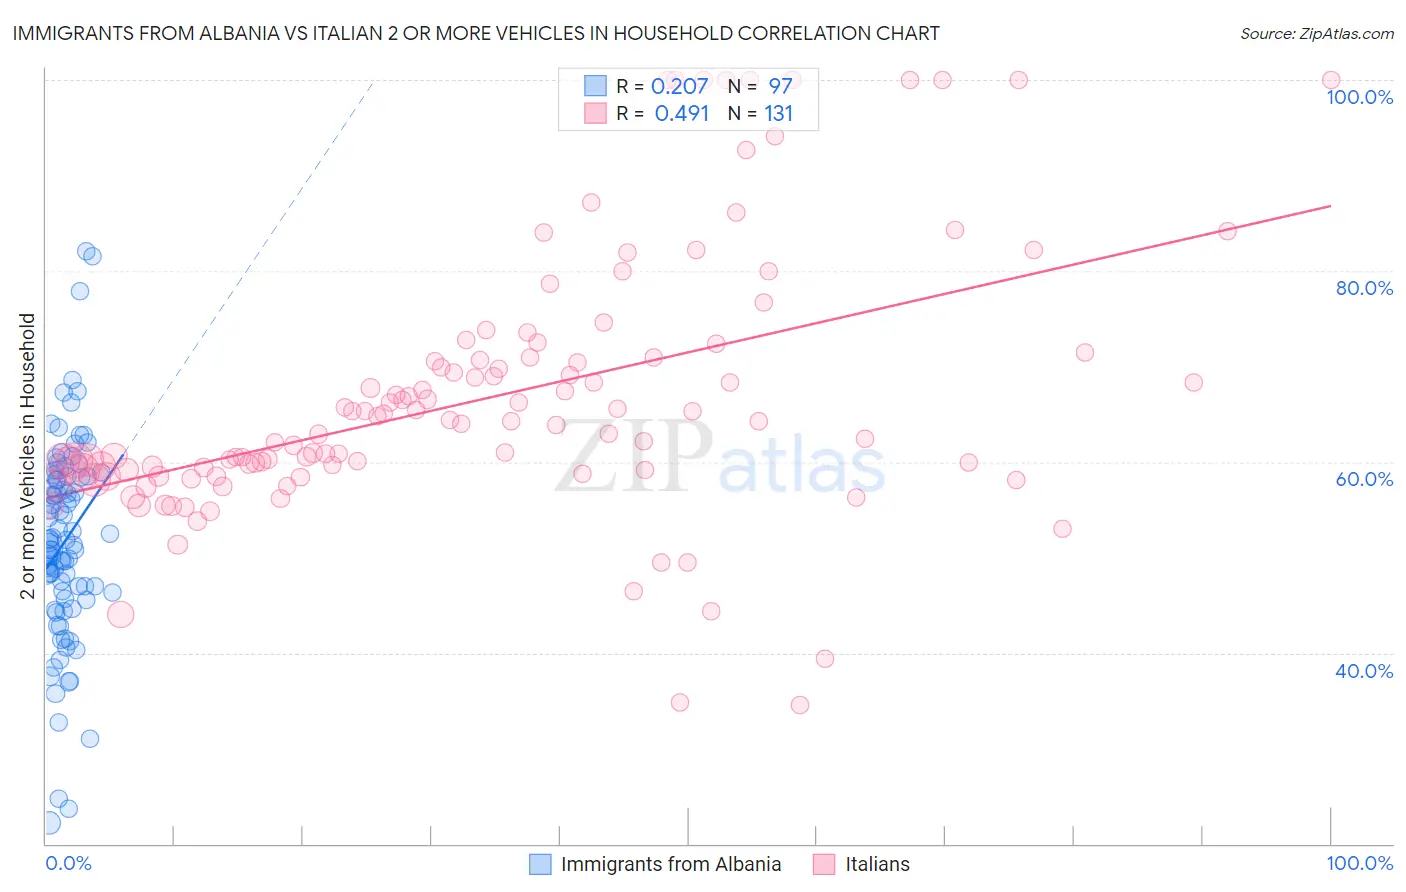
Immigrants from Albania vs Italian 2 or more Vehicles in Household Correlation Chart
The statistical analysis conducted on geographies consisting of 119,187,610 people shows a weak positive correlation between the proportion of Immigrants from Albania and percentage of households with 2 or more vehicles available in the United States with a correlation coefficient (R) of 0.207 and weighted average of 46.0%. Similarly, the statistical analysis conducted on geographies consisting of 574,514,486 people shows a moderate positive correlation between the proportion of Italians and percentage of households with 2 or more vehicles available in the United States with a correlation coefficient (R) of 0.491 and weighted average of 58.4%, a difference of 27.0%.
2 or more Vehicles in Household Correlation Summary
| Measurement | Immigrants from Albania | Italian |
| Minimum | 22.2% | 34.5% |
| Maximum | 82.0% | 100.0% |
| Range | 59.8% | 65.5% |
| Mean | 51.7% | 66.7% |
| Median | 51.5% | 64.0% |
| Interquartile 25% (IQ1) | 46.0% | 59.0% |
| Interquartile 75% (IQ3) | 58.5% | 70.9% |
| Interquartile Range (IQR) | 12.5% | 11.9% |
| Standard Deviation (Sample) | 10.7% | 13.8% |
| Standard Deviation (Population) | 10.7% | 13.7% |
Similar Demographics by 2 or more Vehicles in Household
Demographics Similar to Immigrants from Albania by 2 or more Vehicles in Household
In terms of 2 or more vehicles in household, the demographic groups most similar to Immigrants from Albania are Jamaican (45.8%, a difference of 0.52%), Soviet Union (45.7%, a difference of 0.58%), Immigrants from Haiti (46.5%, a difference of 1.1%), Cape Verdean (46.8%, a difference of 1.7%), and Puerto Rican (47.1%, a difference of 2.4%).
| Demographics | Rating | Rank | 2 or more Vehicles in Household |
| Immigrants | Belarus | 0.0 /100 | #311 | Tragic 47.9% |
| Haitians | 0.0 /100 | #312 | Tragic 47.6% |
| U.S. Virgin Islanders | 0.0 /100 | #313 | Tragic 47.5% |
| Immigrants | Ghana | 0.0 /100 | #314 | Tragic 47.4% |
| Puerto Ricans | 0.0 /100 | #315 | Tragic 47.1% |
| Cape Verdeans | 0.0 /100 | #316 | Tragic 46.8% |
| Immigrants | Haiti | 0.0 /100 | #317 | Tragic 46.5% |
| Immigrants | Albania | 0.0 /100 | #318 | Tragic 46.0% |
| Jamaicans | 0.0 /100 | #319 | Tragic 45.8% |
| Soviet Union | 0.0 /100 | #320 | Tragic 45.7% |
| Immigrants | Jamaica | 0.0 /100 | #321 | Tragic 44.5% |
| Senegalese | 0.0 /100 | #322 | Tragic 44.2% |
| Immigrants | Caribbean | 0.0 /100 | #323 | Tragic 44.2% |
| Immigrants | Cabo Verde | 0.0 /100 | #324 | Tragic 43.3% |
| Immigrants | West Indies | 0.0 /100 | #325 | Tragic 43.1% |
Demographics Similar to Italians by 2 or more Vehicles in Household
In terms of 2 or more vehicles in household, the demographic groups most similar to Italians are Bangladeshi (58.4%, a difference of 0.020%), Austrian (58.4%, a difference of 0.050%), Pennsylvania German (58.5%, a difference of 0.11%), Bolivian (58.3%, a difference of 0.17%), and Immigrants from Afghanistan (58.3%, a difference of 0.18%).
| Demographics | Rating | Rank | 2 or more Vehicles in Household |
| Mexican American Indians | 99.8 /100 | #63 | Exceptional 58.7% |
| Portuguese | 99.7 /100 | #64 | Exceptional 58.6% |
| Immigrants | Central America | 99.7 /100 | #65 | Exceptional 58.6% |
| Croatians | 99.7 /100 | #66 | Exceptional 58.6% |
| Laotians | 99.7 /100 | #67 | Exceptional 58.6% |
| Canadians | 99.7 /100 | #68 | Exceptional 58.6% |
| Pennsylvania Germans | 99.7 /100 | #69 | Exceptional 58.5% |
| Italians | 99.6 /100 | #70 | Exceptional 58.4% |
| Bangladeshis | 99.6 /100 | #71 | Exceptional 58.4% |
| Austrians | 99.6 /100 | #72 | Exceptional 58.4% |
| Bolivians | 99.6 /100 | #73 | Exceptional 58.3% |
| Immigrants | Afghanistan | 99.6 /100 | #74 | Exceptional 58.3% |
| Poles | 99.5 /100 | #75 | Exceptional 58.3% |
| Creek | 99.5 /100 | #76 | Exceptional 58.3% |
| Slovenes | 99.5 /100 | #77 | Exceptional 58.3% |