Immigrants from Albania vs Immigrants from India 2 or more Vehicles in Household
COMPARE
Immigrants from Albania
Immigrants from India
2 or more Vehicles in Household
2 or more Vehicles in Household Comparison
Immigrants from Albania
Immigrants from India
46.0%
2 OR MORE VEHICLES IN HOUSEHOLD
0.0/ 100
METRIC RATING
318th/ 347
METRIC RANK
59.3%
2 OR MORE VEHICLES IN HOUSEHOLD
99.9/ 100
METRIC RATING
48th/ 347
METRIC RANK
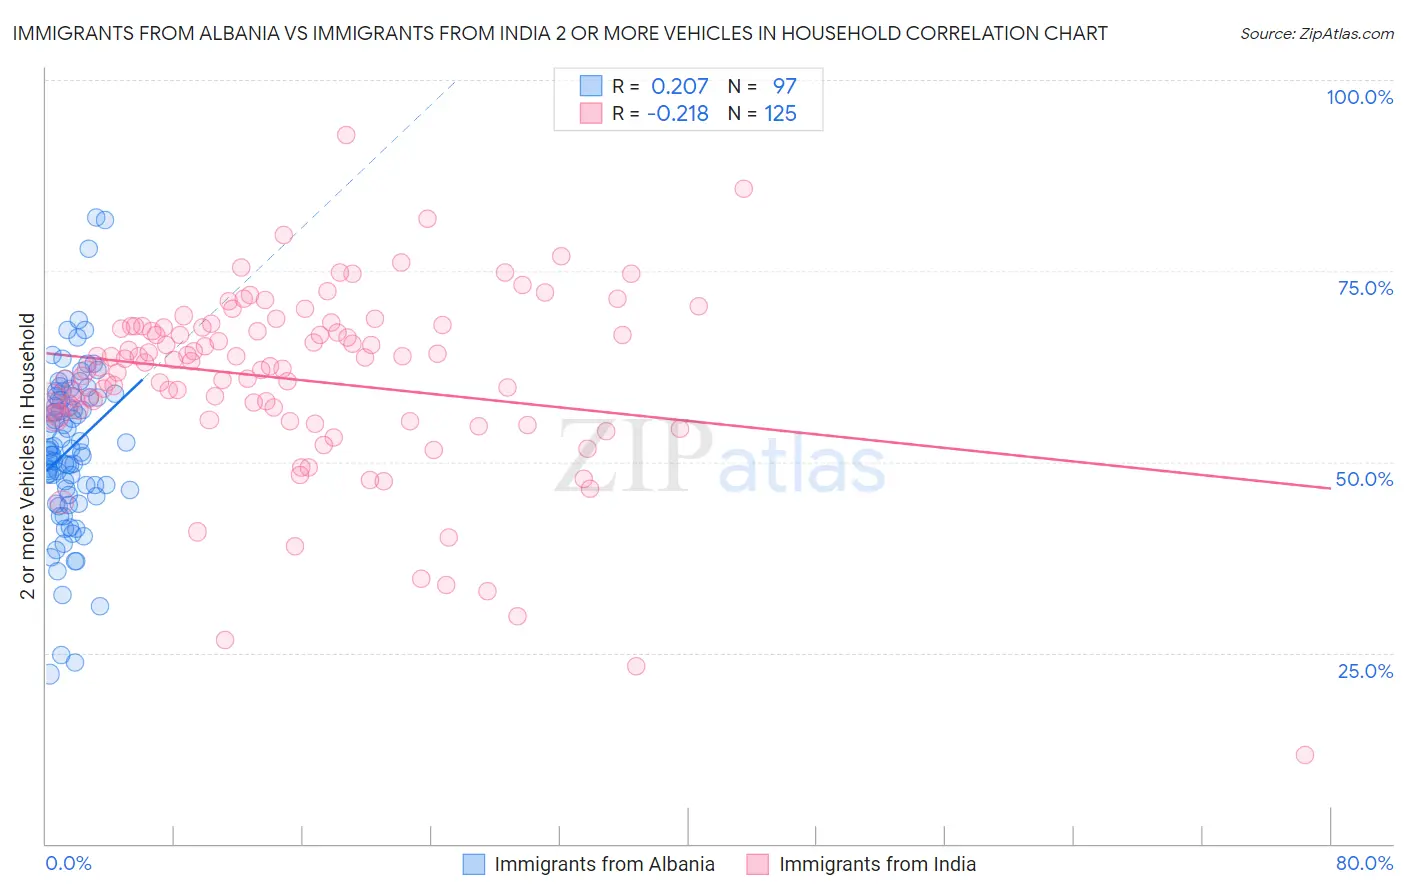
Immigrants from Albania vs Immigrants from India 2 or more Vehicles in Household Correlation Chart
The statistical analysis conducted on geographies consisting of 119,187,610 people shows a weak positive correlation between the proportion of Immigrants from Albania and percentage of households with 2 or more vehicles available in the United States with a correlation coefficient (R) of 0.207 and weighted average of 46.0%. Similarly, the statistical analysis conducted on geographies consisting of 433,787,530 people shows a weak negative correlation between the proportion of Immigrants from India and percentage of households with 2 or more vehicles available in the United States with a correlation coefficient (R) of -0.218 and weighted average of 59.3%, a difference of 28.9%.
2 or more Vehicles in Household Correlation Summary
| Measurement | Immigrants from Albania | Immigrants from India |
| Minimum | 22.2% | 11.6% |
| Maximum | 82.0% | 92.9% |
| Range | 59.8% | 81.2% |
| Mean | 51.7% | 60.8% |
| Median | 51.5% | 63.0% |
| Interquartile 25% (IQ1) | 46.0% | 55.9% |
| Interquartile 75% (IQ3) | 58.5% | 67.7% |
| Interquartile Range (IQR) | 12.5% | 11.7% |
| Standard Deviation (Sample) | 10.7% | 12.0% |
| Standard Deviation (Population) | 10.7% | 12.0% |
Similar Demographics by 2 or more Vehicles in Household
Demographics Similar to Immigrants from Albania by 2 or more Vehicles in Household
In terms of 2 or more vehicles in household, the demographic groups most similar to Immigrants from Albania are Jamaican (45.8%, a difference of 0.52%), Soviet Union (45.7%, a difference of 0.58%), Immigrants from Haiti (46.5%, a difference of 1.1%), Cape Verdean (46.8%, a difference of 1.7%), and Puerto Rican (47.1%, a difference of 2.4%).
| Demographics | Rating | Rank | 2 or more Vehicles in Household |
| Immigrants | Belarus | 0.0 /100 | #311 | Tragic 47.9% |
| Haitians | 0.0 /100 | #312 | Tragic 47.6% |
| U.S. Virgin Islanders | 0.0 /100 | #313 | Tragic 47.5% |
| Immigrants | Ghana | 0.0 /100 | #314 | Tragic 47.4% |
| Puerto Ricans | 0.0 /100 | #315 | Tragic 47.1% |
| Cape Verdeans | 0.0 /100 | #316 | Tragic 46.8% |
| Immigrants | Haiti | 0.0 /100 | #317 | Tragic 46.5% |
| Immigrants | Albania | 0.0 /100 | #318 | Tragic 46.0% |
| Jamaicans | 0.0 /100 | #319 | Tragic 45.8% |
| Soviet Union | 0.0 /100 | #320 | Tragic 45.7% |
| Immigrants | Jamaica | 0.0 /100 | #321 | Tragic 44.5% |
| Senegalese | 0.0 /100 | #322 | Tragic 44.2% |
| Immigrants | Caribbean | 0.0 /100 | #323 | Tragic 44.2% |
| Immigrants | Cabo Verde | 0.0 /100 | #324 | Tragic 43.3% |
| Immigrants | West Indies | 0.0 /100 | #325 | Tragic 43.1% |
Demographics Similar to Immigrants from India by 2 or more Vehicles in Household
In terms of 2 or more vehicles in household, the demographic groups most similar to Immigrants from India are Yaqui (59.3%, a difference of 0.020%), Belgian (59.3%, a difference of 0.040%), Choctaw (59.3%, a difference of 0.040%), Spaniard (59.2%, a difference of 0.18%), and Immigrants from Laos (59.2%, a difference of 0.19%).
| Demographics | Rating | Rank | 2 or more Vehicles in Household |
| Northern Europeans | 100.0 /100 | #41 | Exceptional 59.9% |
| Malaysians | 100.0 /100 | #42 | Exceptional 59.8% |
| Czechoslovakians | 100.0 /100 | #43 | Exceptional 59.8% |
| French | 100.0 /100 | #44 | Exceptional 59.8% |
| Immigrants | Taiwan | 100.0 /100 | #45 | Exceptional 59.7% |
| Immigrants | South Eastern Asia | 100.0 /100 | #46 | Exceptional 59.6% |
| Yaqui | 99.9 /100 | #47 | Exceptional 59.3% |
| Immigrants | India | 99.9 /100 | #48 | Exceptional 59.3% |
| Belgians | 99.9 /100 | #49 | Exceptional 59.3% |
| Choctaw | 99.9 /100 | #50 | Exceptional 59.3% |
| Spaniards | 99.9 /100 | #51 | Exceptional 59.2% |
| Immigrants | Laos | 99.9 /100 | #52 | Exceptional 59.2% |
| Celtics | 99.9 /100 | #53 | Exceptional 59.2% |
| Bhutanese | 99.9 /100 | #54 | Exceptional 59.1% |
| Luxembourgers | 99.9 /100 | #55 | Exceptional 59.1% |