Immigrants from Albania vs Nicaraguan 2 or more Vehicles in Household
COMPARE
Immigrants from Albania
Nicaraguan
2 or more Vehicles in Household
2 or more Vehicles in Household Comparison
Immigrants from Albania
Nicaraguans
46.0%
2 OR MORE VEHICLES IN HOUSEHOLD
0.0/ 100
METRIC RATING
318th/ 347
METRIC RANK
56.1%
2 OR MORE VEHICLES IN HOUSEHOLD
79.9/ 100
METRIC RATING
150th/ 347
METRIC RANK
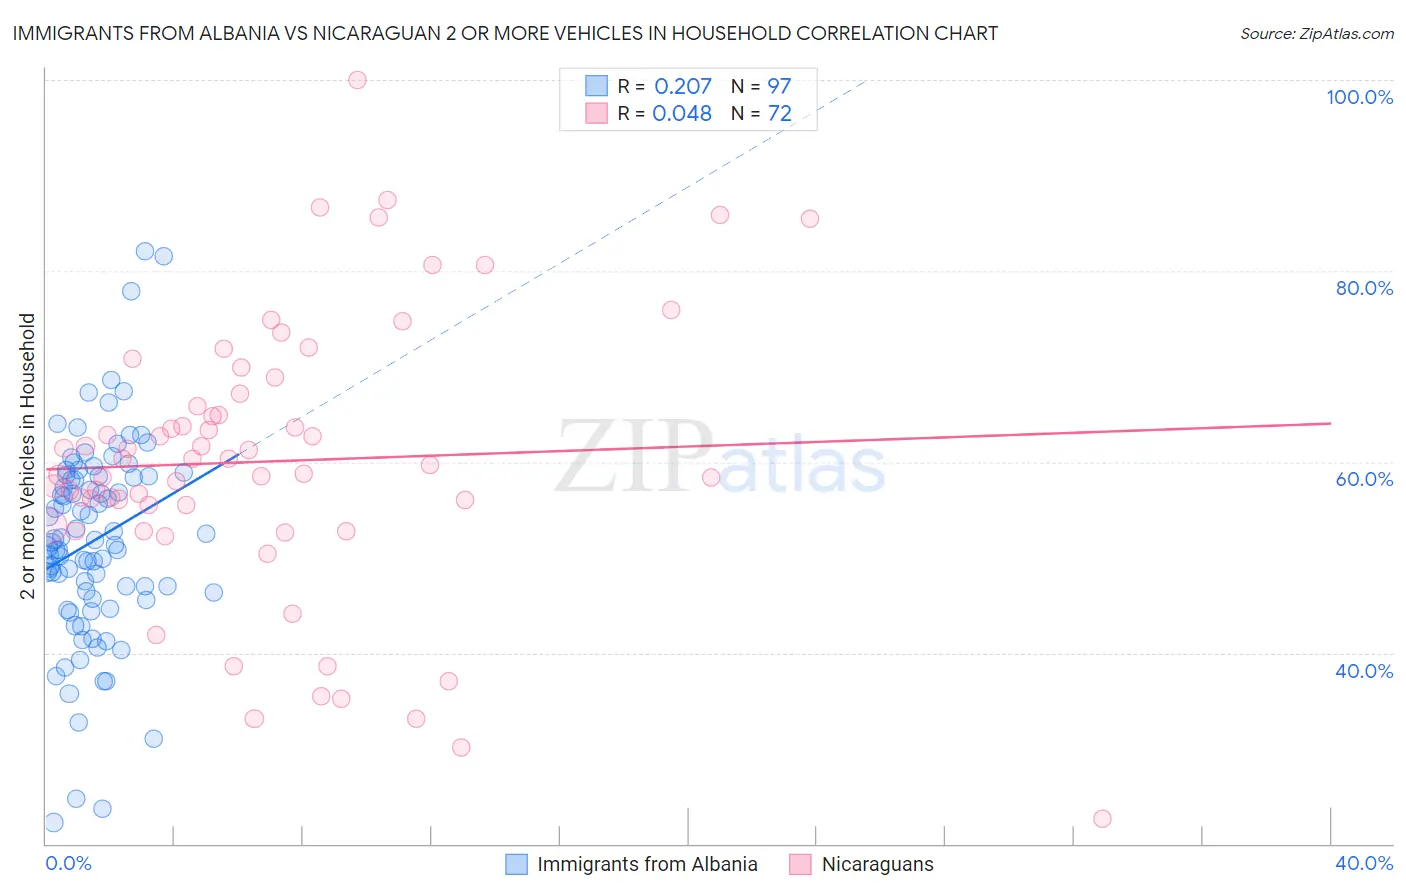
Immigrants from Albania vs Nicaraguan 2 or more Vehicles in Household Correlation Chart
The statistical analysis conducted on geographies consisting of 119,187,610 people shows a weak positive correlation between the proportion of Immigrants from Albania and percentage of households with 2 or more vehicles available in the United States with a correlation coefficient (R) of 0.207 and weighted average of 46.0%. Similarly, the statistical analysis conducted on geographies consisting of 285,625,326 people shows no correlation between the proportion of Nicaraguans and percentage of households with 2 or more vehicles available in the United States with a correlation coefficient (R) of 0.048 and weighted average of 56.1%, a difference of 22.0%.
2 or more Vehicles in Household Correlation Summary
| Measurement | Immigrants from Albania | Nicaraguan |
| Minimum | 22.2% | 22.6% |
| Maximum | 82.0% | 100.0% |
| Range | 59.8% | 77.4% |
| Mean | 51.7% | 60.1% |
| Median | 51.5% | 60.0% |
| Interquartile 25% (IQ1) | 46.0% | 54.4% |
| Interquartile 75% (IQ3) | 58.5% | 66.5% |
| Interquartile Range (IQR) | 12.5% | 12.1% |
| Standard Deviation (Sample) | 10.7% | 14.6% |
| Standard Deviation (Population) | 10.7% | 14.5% |
Similar Demographics by 2 or more Vehicles in Household
Demographics Similar to Immigrants from Albania by 2 or more Vehicles in Household
In terms of 2 or more vehicles in household, the demographic groups most similar to Immigrants from Albania are Jamaican (45.8%, a difference of 0.52%), Soviet Union (45.7%, a difference of 0.58%), Immigrants from Haiti (46.5%, a difference of 1.1%), Cape Verdean (46.8%, a difference of 1.7%), and Puerto Rican (47.1%, a difference of 2.4%).
| Demographics | Rating | Rank | 2 or more Vehicles in Household |
| Immigrants | Belarus | 0.0 /100 | #311 | Tragic 47.9% |
| Haitians | 0.0 /100 | #312 | Tragic 47.6% |
| U.S. Virgin Islanders | 0.0 /100 | #313 | Tragic 47.5% |
| Immigrants | Ghana | 0.0 /100 | #314 | Tragic 47.4% |
| Puerto Ricans | 0.0 /100 | #315 | Tragic 47.1% |
| Cape Verdeans | 0.0 /100 | #316 | Tragic 46.8% |
| Immigrants | Haiti | 0.0 /100 | #317 | Tragic 46.5% |
| Immigrants | Albania | 0.0 /100 | #318 | Tragic 46.0% |
| Jamaicans | 0.0 /100 | #319 | Tragic 45.8% |
| Soviet Union | 0.0 /100 | #320 | Tragic 45.7% |
| Immigrants | Jamaica | 0.0 /100 | #321 | Tragic 44.5% |
| Senegalese | 0.0 /100 | #322 | Tragic 44.2% |
| Immigrants | Caribbean | 0.0 /100 | #323 | Tragic 44.2% |
| Immigrants | Cabo Verde | 0.0 /100 | #324 | Tragic 43.3% |
| Immigrants | West Indies | 0.0 /100 | #325 | Tragic 43.1% |
Demographics Similar to Nicaraguans by 2 or more Vehicles in Household
In terms of 2 or more vehicles in household, the demographic groups most similar to Nicaraguans are Immigrants from Moldova (56.1%, a difference of 0.020%), Chilean (56.1%, a difference of 0.020%), Serbian (56.1%, a difference of 0.030%), Venezuelan (56.1%, a difference of 0.050%), and Immigrants from Northern Europe (56.1%, a difference of 0.070%).
| Demographics | Rating | Rank | 2 or more Vehicles in Household |
| Seminole | 81.7 /100 | #143 | Excellent 56.2% |
| Immigrants | Syria | 81.4 /100 | #144 | Excellent 56.2% |
| Syrians | 81.2 /100 | #145 | Excellent 56.2% |
| Venezuelans | 80.7 /100 | #146 | Excellent 56.1% |
| Serbians | 80.3 /100 | #147 | Excellent 56.1% |
| Immigrants | Moldova | 80.2 /100 | #148 | Excellent 56.1% |
| Chileans | 80.2 /100 | #149 | Excellent 56.1% |
| Nicaraguans | 79.9 /100 | #150 | Good 56.1% |
| Immigrants | Northern Europe | 78.7 /100 | #151 | Good 56.1% |
| Immigrants | Pakistan | 78.1 /100 | #152 | Good 56.1% |
| Lumbee | 71.9 /100 | #153 | Good 55.9% |
| Ukrainians | 70.8 /100 | #154 | Good 55.8% |
| Immigrants | Venezuela | 70.7 /100 | #155 | Good 55.8% |
| Immigrants | Lithuania | 70.4 /100 | #156 | Good 55.8% |
| Immigrants | Kuwait | 70.2 /100 | #157 | Good 55.8% |