Immigrants from Albania vs Marshallese Self-Care Disability
COMPARE
Immigrants from Albania
Marshallese
Self-Care Disability
Self-Care Disability Comparison
Immigrants from Albania
Marshallese
2.6%
SELF-CARE DISABILITY
0.6/ 100
METRIC RATING
247th/ 347
METRIC RANK
2.6%
SELF-CARE DISABILITY
1.2/ 100
METRIC RATING
240th/ 347
METRIC RANK
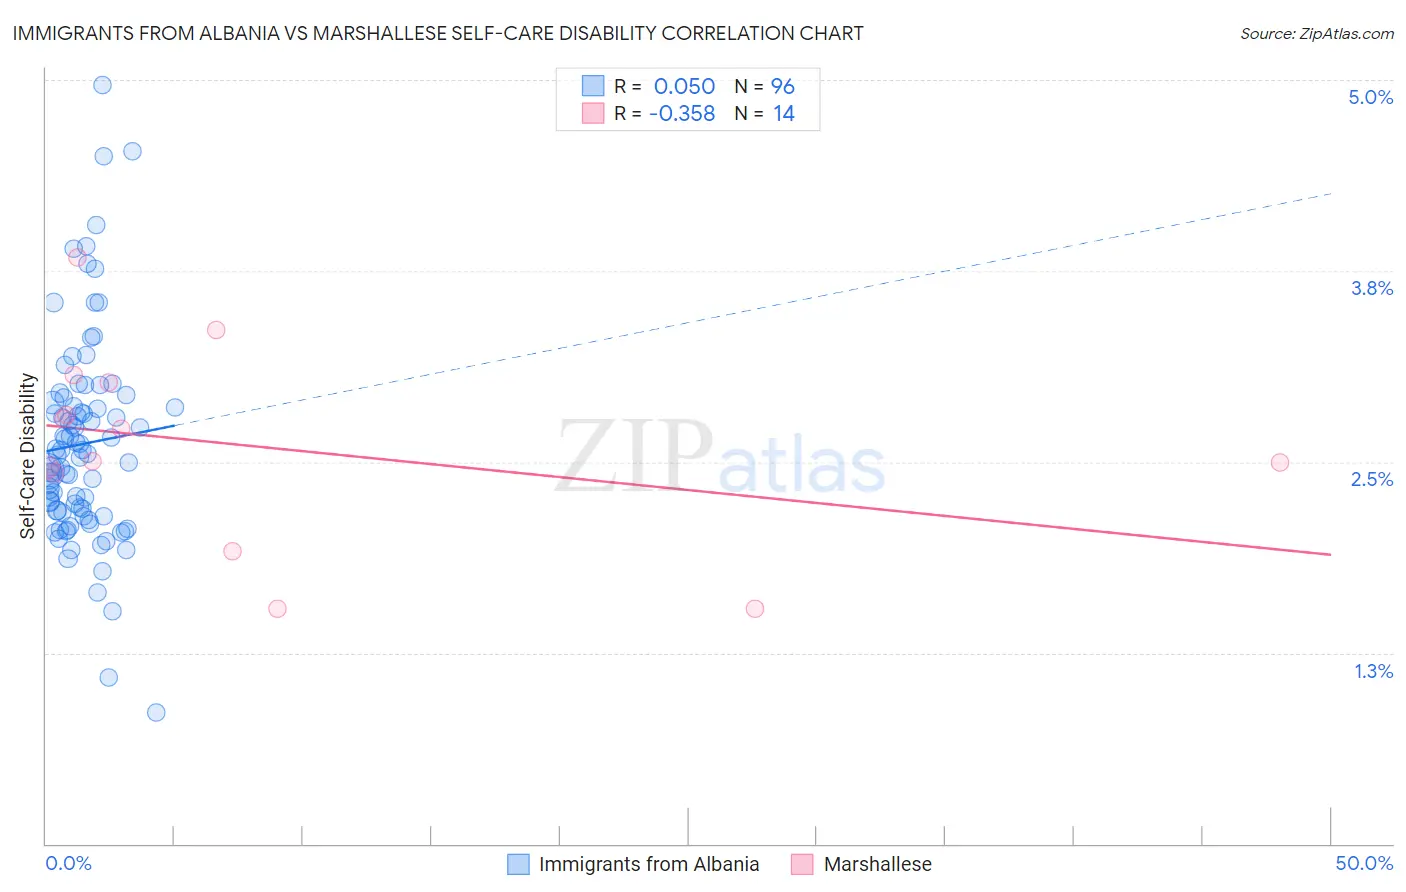
Immigrants from Albania vs Marshallese Self-Care Disability Correlation Chart
The statistical analysis conducted on geographies consisting of 119,364,841 people shows a slight positive correlation between the proportion of Immigrants from Albania and percentage of population with self-care disability in the United States with a correlation coefficient (R) of 0.050 and weighted average of 2.6%. Similarly, the statistical analysis conducted on geographies consisting of 14,760,594 people shows a mild negative correlation between the proportion of Marshallese and percentage of population with self-care disability in the United States with a correlation coefficient (R) of -0.358 and weighted average of 2.6%, a difference of 0.85%.
Self-Care Disability Correlation Summary
| Measurement | Immigrants from Albania | Marshallese |
| Minimum | 0.86% | 1.5% |
| Maximum | 5.0% | 3.8% |
| Range | 4.1% | 2.3% |
| Mean | 2.6% | 2.6% |
| Median | 2.5% | 2.6% |
| Interquartile 25% (IQ1) | 2.2% | 2.4% |
| Interquartile 75% (IQ3) | 2.9% | 3.0% |
| Interquartile Range (IQR) | 0.70% | 0.59% |
| Standard Deviation (Sample) | 0.68% | 0.64% |
| Standard Deviation (Population) | 0.67% | 0.62% |
Demographics Similar to Immigrants from Albania and Marshallese by Self-Care Disability
In terms of self-care disability, the demographic groups most similar to Immigrants from Albania are Nicaraguan (2.6%, a difference of 0.0%), Cheyenne (2.6%, a difference of 0.13%), Immigrants from Western Asia (2.6%, a difference of 0.15%), Mexican American Indian (2.6%, a difference of 0.24%), and Portuguese (2.6%, a difference of 0.32%). Similarly, the demographic groups most similar to Marshallese are Immigrants from Panama (2.6%, a difference of 0.030%), Senegalese (2.6%, a difference of 0.070%), Immigrants from Syria (2.6%, a difference of 0.17%), Immigrants from Senegal (2.6%, a difference of 0.33%), and Spanish (2.6%, a difference of 0.41%).
| Demographics | Rating | Rank | Self-Care Disability |
| Liberians | 2.1 /100 | #233 | Tragic 2.6% |
| Vietnamese | 2.1 /100 | #234 | Tragic 2.6% |
| Bahamians | 2.0 /100 | #235 | Tragic 2.6% |
| Bermudans | 1.9 /100 | #236 | Tragic 2.6% |
| Immigrants | Senegal | 1.6 /100 | #237 | Tragic 2.6% |
| Senegalese | 1.3 /100 | #238 | Tragic 2.6% |
| Immigrants | Panama | 1.2 /100 | #239 | Tragic 2.6% |
| Marshallese | 1.2 /100 | #240 | Tragic 2.6% |
| Immigrants | Syria | 1.0 /100 | #241 | Tragic 2.6% |
| Spanish | 0.8 /100 | #242 | Tragic 2.6% |
| Hawaiians | 0.8 /100 | #243 | Tragic 2.6% |
| Yuman | 0.8 /100 | #244 | Tragic 2.6% |
| Immigrants | Western Asia | 0.6 /100 | #245 | Tragic 2.6% |
| Cheyenne | 0.6 /100 | #246 | Tragic 2.6% |
| Immigrants | Albania | 0.6 /100 | #247 | Tragic 2.6% |
| Nicaraguans | 0.6 /100 | #248 | Tragic 2.6% |
| Mexican American Indians | 0.5 /100 | #249 | Tragic 2.6% |
| Portuguese | 0.4 /100 | #250 | Tragic 2.6% |
| Immigrants | Liberia | 0.4 /100 | #251 | Tragic 2.6% |
| Immigrants | Bangladesh | 0.4 /100 | #252 | Tragic 2.6% |
| Immigrants | Haiti | 0.3 /100 | #253 | Tragic 2.6% |