Immigrants from Albania vs Marshallese In Labor Force | Age 35-44
COMPARE
Immigrants from Albania
Marshallese
In Labor Force | Age 35-44
In Labor Force | Age 35-44 Comparison
Immigrants from Albania
Marshallese
85.1%
IN LABOR FORCE | AGE 35-44
99.7/ 100
METRIC RATING
51st/ 347
METRIC RANK
82.4%
IN LABOR FORCE | AGE 35-44
0.0/ 100
METRIC RATING
304th/ 347
METRIC RANK
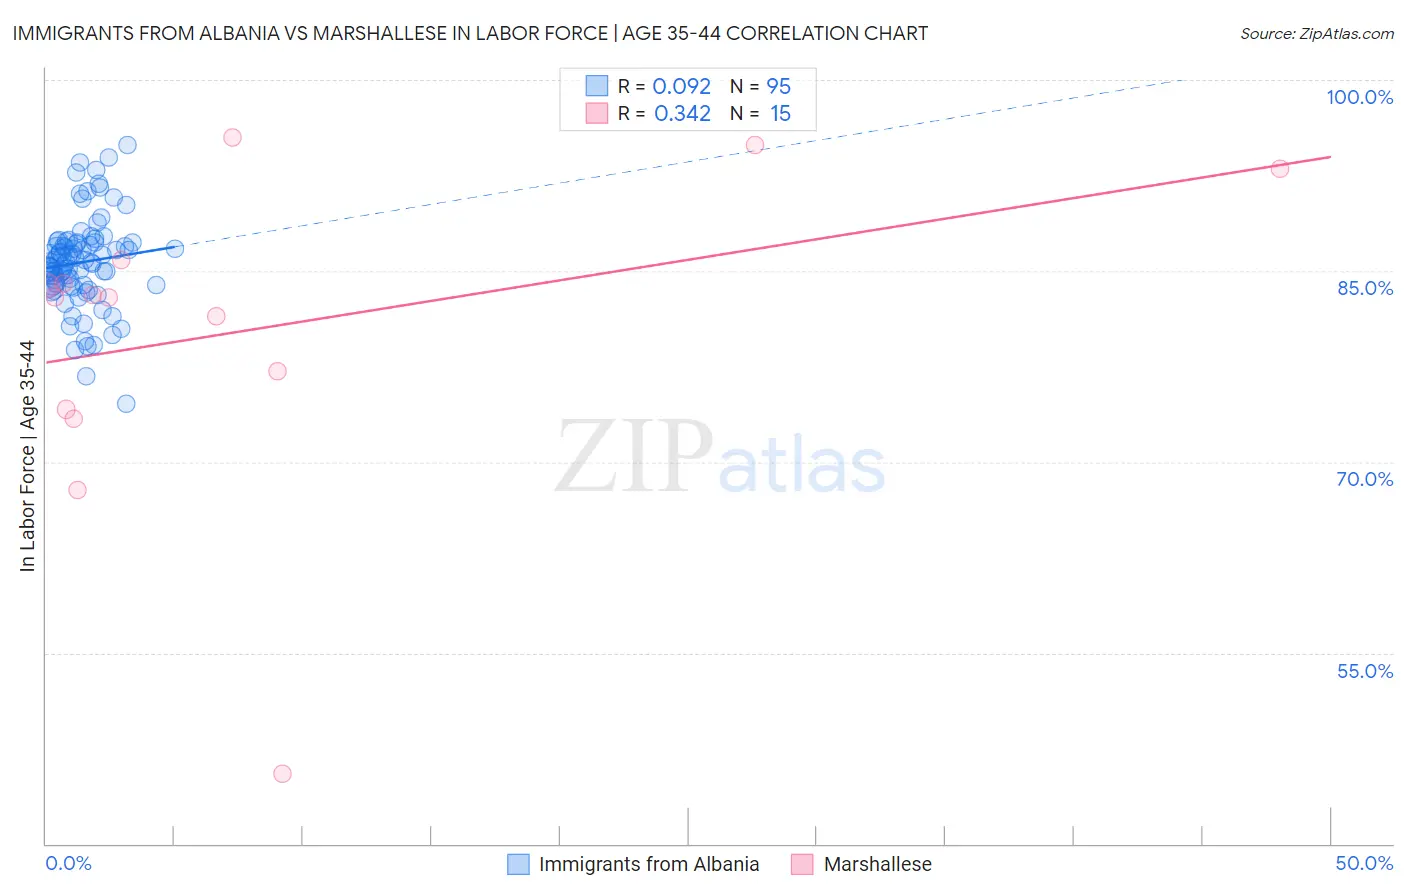
Immigrants from Albania vs Marshallese In Labor Force | Age 35-44 Correlation Chart
The statistical analysis conducted on geographies consisting of 119,387,353 people shows a slight positive correlation between the proportion of Immigrants from Albania and labor force participation rate among population between the ages 35 and 44 in the United States with a correlation coefficient (R) of 0.092 and weighted average of 85.1%. Similarly, the statistical analysis conducted on geographies consisting of 14,760,991 people shows a mild positive correlation between the proportion of Marshallese and labor force participation rate among population between the ages 35 and 44 in the United States with a correlation coefficient (R) of 0.342 and weighted average of 82.4%, a difference of 3.3%.
In Labor Force | Age 35-44 Correlation Summary
| Measurement | Immigrants from Albania | Marshallese |
| Minimum | 74.6% | 45.5% |
| Maximum | 94.9% | 95.5% |
| Range | 20.3% | 50.0% |
| Mean | 85.7% | 80.4% |
| Median | 85.7% | 83.0% |
| Interquartile 25% (IQ1) | 83.9% | 74.1% |
| Interquartile 75% (IQ3) | 87.2% | 85.9% |
| Interquartile Range (IQR) | 3.3% | 11.8% |
| Standard Deviation (Sample) | 3.6% | 12.4% |
| Standard Deviation (Population) | 3.6% | 12.0% |
Similar Demographics by In Labor Force | Age 35-44
Demographics Similar to Immigrants from Albania by In Labor Force | Age 35-44
In terms of in labor force | age 35-44, the demographic groups most similar to Immigrants from Albania are Thai (85.2%, a difference of 0.0%), Croatian (85.2%, a difference of 0.030%), Immigrants from Kenya (85.1%, a difference of 0.030%), Immigrants from Eritrea (85.2%, a difference of 0.040%), and Taiwanese (85.1%, a difference of 0.040%).
| Demographics | Rating | Rank | In Labor Force | Age 35-44 |
| Lithuanians | 99.8 /100 | #44 | Exceptional 85.2% |
| Cypriots | 99.8 /100 | #45 | Exceptional 85.2% |
| Immigrants | Hong Kong | 99.8 /100 | #46 | Exceptional 85.2% |
| German Russians | 99.8 /100 | #47 | Exceptional 85.2% |
| Immigrants | Eritrea | 99.7 /100 | #48 | Exceptional 85.2% |
| Croatians | 99.7 /100 | #49 | Exceptional 85.2% |
| Thais | 99.7 /100 | #50 | Exceptional 85.2% |
| Immigrants | Albania | 99.7 /100 | #51 | Exceptional 85.1% |
| Immigrants | Kenya | 99.6 /100 | #52 | Exceptional 85.1% |
| Taiwanese | 99.6 /100 | #53 | Exceptional 85.1% |
| Turks | 99.5 /100 | #54 | Exceptional 85.1% |
| Soviet Union | 99.5 /100 | #55 | Exceptional 85.1% |
| Immigrants | Croatia | 99.5 /100 | #56 | Exceptional 85.1% |
| Chinese | 99.4 /100 | #57 | Exceptional 85.1% |
| Slovaks | 99.4 /100 | #58 | Exceptional 85.1% |
Demographics Similar to Marshallese by In Labor Force | Age 35-44
In terms of in labor force | age 35-44, the demographic groups most similar to Marshallese are American (82.4%, a difference of 0.010%), Nepalese (82.4%, a difference of 0.010%), Spanish American Indian (82.5%, a difference of 0.080%), Central American Indian (82.5%, a difference of 0.11%), and Tlingit-Haida (82.5%, a difference of 0.17%).
| Demographics | Rating | Rank | In Labor Force | Age 35-44 |
| Hmong | 0.0 /100 | #297 | Tragic 82.6% |
| Ottawa | 0.0 /100 | #298 | Tragic 82.6% |
| Tlingit-Haida | 0.0 /100 | #299 | Tragic 82.5% |
| Central American Indians | 0.0 /100 | #300 | Tragic 82.5% |
| Spanish American Indians | 0.0 /100 | #301 | Tragic 82.5% |
| Americans | 0.0 /100 | #302 | Tragic 82.4% |
| Nepalese | 0.0 /100 | #303 | Tragic 82.4% |
| Marshallese | 0.0 /100 | #304 | Tragic 82.4% |
| Shoshone | 0.0 /100 | #305 | Tragic 82.2% |
| Blacks/African Americans | 0.0 /100 | #306 | Tragic 82.2% |
| Hispanics or Latinos | 0.0 /100 | #307 | Tragic 82.1% |
| Immigrants | Central America | 0.0 /100 | #308 | Tragic 82.0% |
| Cree | 0.0 /100 | #309 | Tragic 82.0% |
| Blackfeet | 0.0 /100 | #310 | Tragic 81.9% |
| Colville | 0.0 /100 | #311 | Tragic 81.7% |