Tohono O'odham vs Marshallese 2 or more Vehicles in Household
COMPARE
Tohono O'odham
Marshallese
2 or more Vehicles in Household
2 or more Vehicles in Household Comparison
Tohono O'odham
Marshallese
50.0%
2 OR MORE VEHICLES IN HOUSEHOLD
0.0/ 100
METRIC RATING
303rd/ 347
METRIC RANK
54.9%
2 OR MORE VEHICLES IN HOUSEHOLD
30.5/ 100
METRIC RATING
188th/ 347
METRIC RANK
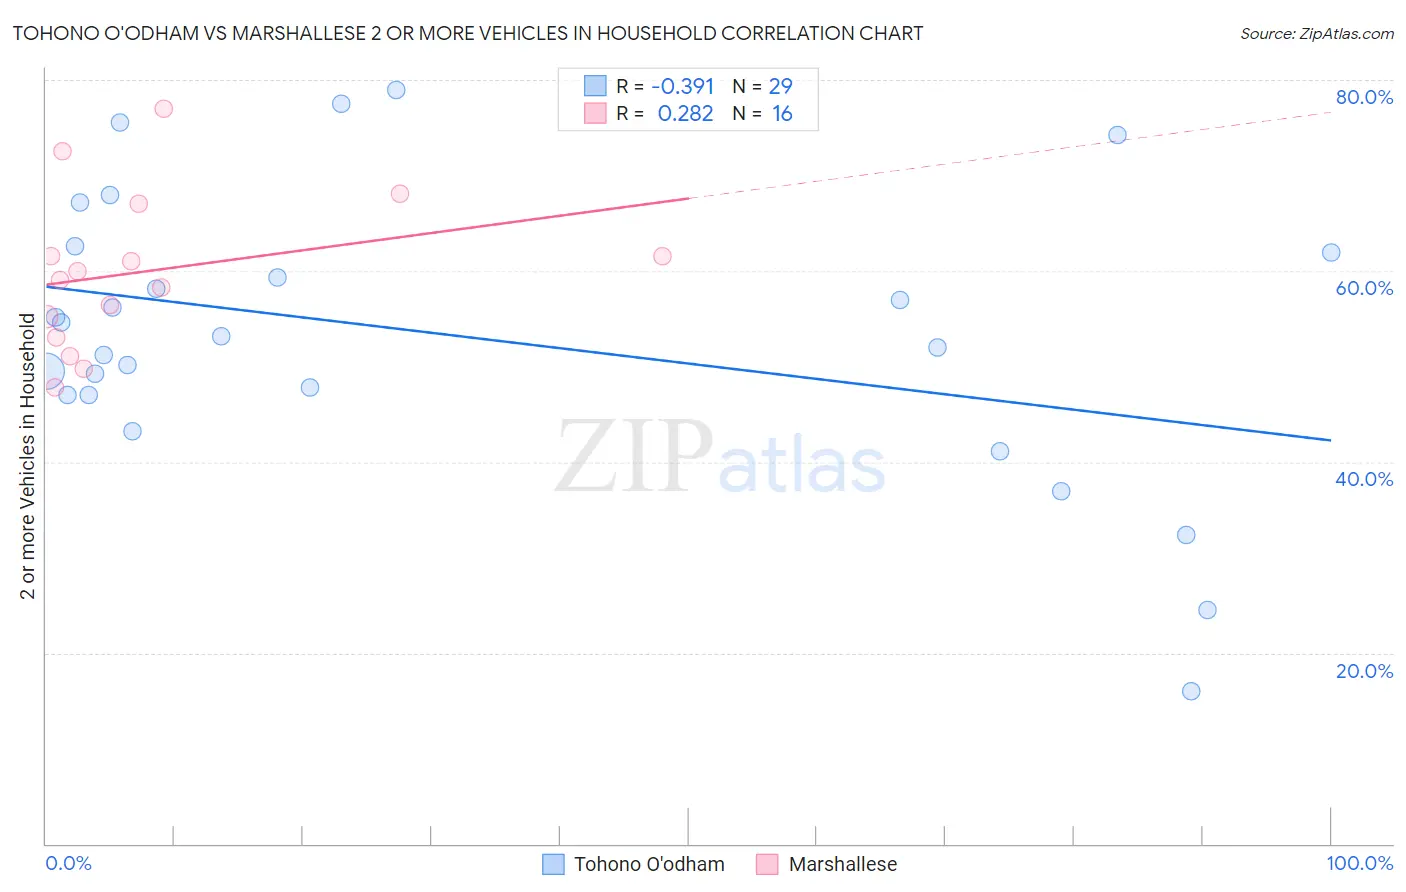
Tohono O'odham vs Marshallese 2 or more Vehicles in Household Correlation Chart
The statistical analysis conducted on geographies consisting of 58,718,439 people shows a mild negative correlation between the proportion of Tohono O'odham and percentage of households with 2 or more vehicles available in the United States with a correlation coefficient (R) of -0.391 and weighted average of 50.0%. Similarly, the statistical analysis conducted on geographies consisting of 14,761,315 people shows a weak positive correlation between the proportion of Marshallese and percentage of households with 2 or more vehicles available in the United States with a correlation coefficient (R) of 0.282 and weighted average of 54.9%, a difference of 9.8%.
2 or more Vehicles in Household Correlation Summary
| Measurement | Tohono O'odham | Marshallese |
| Minimum | 15.9% | 47.8% |
| Maximum | 79.0% | 77.0% |
| Range | 63.1% | 29.3% |
| Mean | 53.3% | 60.0% |
| Median | 53.2% | 59.6% |
| Interquartile 25% (IQ1) | 47.0% | 54.1% |
| Interquartile 75% (IQ3) | 62.2% | 64.3% |
| Interquartile Range (IQR) | 15.3% | 10.2% |
| Standard Deviation (Sample) | 14.9% | 8.1% |
| Standard Deviation (Population) | 14.6% | 7.9% |
Similar Demographics by 2 or more Vehicles in Household
Demographics Similar to Tohono O'odham by 2 or more Vehicles in Household
In terms of 2 or more vehicles in household, the demographic groups most similar to Tohono O'odham are Immigrants from Belize (49.9%, a difference of 0.20%), Immigrants from South America (50.2%, a difference of 0.37%), Immigrants from Greece (50.2%, a difference of 0.43%), Immigrants from Russia (50.3%, a difference of 0.62%), and Immigrants from Morocco (50.3%, a difference of 0.65%).
| Demographics | Rating | Rank | 2 or more Vehicles in Household |
| Immigrants | Somalia | 0.0 /100 | #296 | Tragic 50.5% |
| Immigrants | Spain | 0.0 /100 | #297 | Tragic 50.4% |
| Paraguayans | 0.0 /100 | #298 | Tragic 50.3% |
| Immigrants | Morocco | 0.0 /100 | #299 | Tragic 50.3% |
| Immigrants | Russia | 0.0 /100 | #300 | Tragic 50.3% |
| Immigrants | Greece | 0.0 /100 | #301 | Tragic 50.2% |
| Immigrants | South America | 0.0 /100 | #302 | Tragic 50.2% |
| Tohono O'odham | 0.0 /100 | #303 | Tragic 50.0% |
| Immigrants | Belize | 0.0 /100 | #304 | Tragic 49.9% |
| Immigrants | Western Africa | 0.0 /100 | #305 | Tragic 49.4% |
| Immigrants | Israel | 0.0 /100 | #306 | Tragic 49.2% |
| Hopi | 0.0 /100 | #307 | Tragic 49.0% |
| Albanians | 0.0 /100 | #308 | Tragic 49.0% |
| Moroccans | 0.0 /100 | #309 | Tragic 48.8% |
| Ghanaians | 0.0 /100 | #310 | Tragic 48.0% |
Demographics Similar to Marshallese by 2 or more Vehicles in Household
In terms of 2 or more vehicles in household, the demographic groups most similar to Marshallese are Immigrants from Uganda (55.0%, a difference of 0.13%), Peruvian (55.0%, a difference of 0.15%), Eastern European (54.8%, a difference of 0.15%), Russian (54.8%, a difference of 0.21%), and Arab (55.0%, a difference of 0.24%).
| Demographics | Rating | Rank | 2 or more Vehicles in Household |
| Immigrants | Micronesia | 38.2 /100 | #181 | Fair 55.1% |
| Cree | 38.2 /100 | #182 | Fair 55.1% |
| Immigrants | Cameroon | 37.3 /100 | #183 | Fair 55.1% |
| Apache | 36.7 /100 | #184 | Fair 55.1% |
| Arabs | 35.9 /100 | #185 | Fair 55.0% |
| Peruvians | 33.7 /100 | #186 | Fair 55.0% |
| Immigrants | Uganda | 33.4 /100 | #187 | Fair 55.0% |
| Marshallese | 30.5 /100 | #188 | Fair 54.9% |
| Eastern Europeans | 27.5 /100 | #189 | Fair 54.8% |
| Russians | 26.3 /100 | #190 | Fair 54.8% |
| Immigrants | Immigrants | 25.0 /100 | #191 | Fair 54.7% |
| Immigrants | Romania | 23.8 /100 | #192 | Fair 54.7% |
| Immigrants | Japan | 23.4 /100 | #193 | Fair 54.7% |
| Central Americans | 23.0 /100 | #194 | Fair 54.7% |
| Iroquois | 22.6 /100 | #195 | Fair 54.7% |