Immigrants from Egypt vs Marshallese 2 or more Vehicles in Household
COMPARE
Immigrants from Egypt
Marshallese
2 or more Vehicles in Household
2 or more Vehicles in Household Comparison
Immigrants from Egypt
Marshallese
53.8%
2 OR MORE VEHICLES IN HOUSEHOLD
5.2/ 100
METRIC RATING
225th/ 347
METRIC RANK
54.9%
2 OR MORE VEHICLES IN HOUSEHOLD
30.5/ 100
METRIC RATING
188th/ 347
METRIC RANK
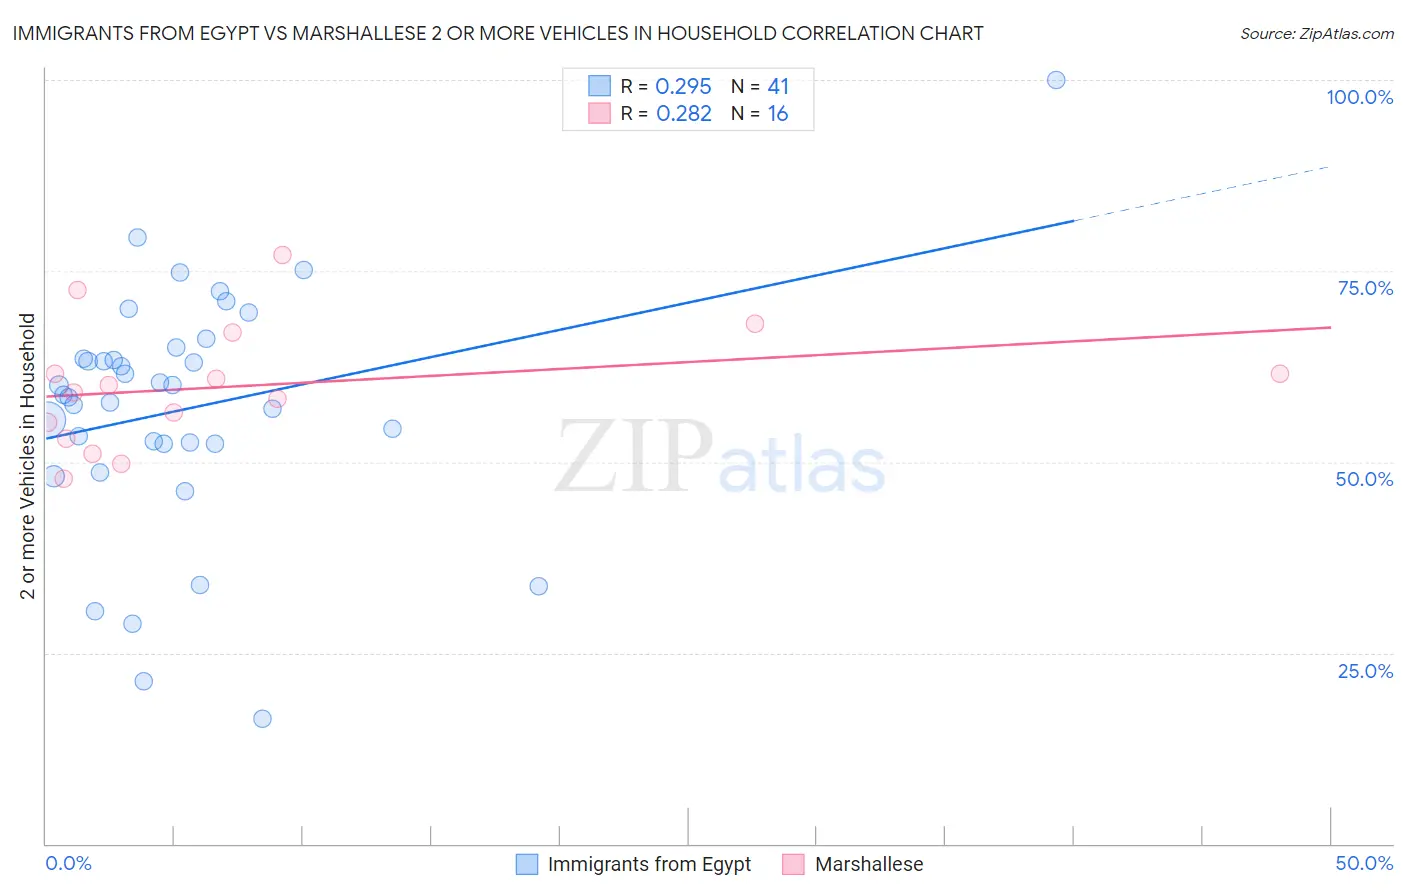
Immigrants from Egypt vs Marshallese 2 or more Vehicles in Household Correlation Chart
The statistical analysis conducted on geographies consisting of 245,432,298 people shows a weak positive correlation between the proportion of Immigrants from Egypt and percentage of households with 2 or more vehicles available in the United States with a correlation coefficient (R) of 0.295 and weighted average of 53.8%. Similarly, the statistical analysis conducted on geographies consisting of 14,761,315 people shows a weak positive correlation between the proportion of Marshallese and percentage of households with 2 or more vehicles available in the United States with a correlation coefficient (R) of 0.282 and weighted average of 54.9%, a difference of 2.1%.
2 or more Vehicles in Household Correlation Summary
| Measurement | Immigrants from Egypt | Marshallese |
| Minimum | 16.3% | 47.8% |
| Maximum | 100.0% | 77.0% |
| Range | 83.7% | 29.3% |
| Mean | 56.9% | 60.0% |
| Median | 58.8% | 59.6% |
| Interquartile 25% (IQ1) | 52.4% | 54.1% |
| Interquartile 75% (IQ3) | 64.2% | 64.3% |
| Interquartile Range (IQR) | 11.8% | 10.2% |
| Standard Deviation (Sample) | 15.9% | 8.1% |
| Standard Deviation (Population) | 15.7% | 7.9% |
Similar Demographics by 2 or more Vehicles in Household
Demographics Similar to Immigrants from Egypt by 2 or more Vehicles in Household
In terms of 2 or more vehicles in household, the demographic groups most similar to Immigrants from Egypt are Brazilian (53.8%, a difference of 0.010%), Immigrants from Eastern Africa (53.7%, a difference of 0.020%), Immigrants from Bosnia and Herzegovina (53.8%, a difference of 0.050%), Kiowa (53.9%, a difference of 0.18%), and Immigrants from Singapore (53.9%, a difference of 0.20%).
| Demographics | Rating | Rank | 2 or more Vehicles in Household |
| Immigrants | Argentina | 6.8 /100 | #218 | Tragic 53.9% |
| South American Indians | 6.5 /100 | #219 | Tragic 53.9% |
| Taiwanese | 6.3 /100 | #220 | Tragic 53.9% |
| Immigrants | Singapore | 6.3 /100 | #221 | Tragic 53.9% |
| Kiowa | 6.2 /100 | #222 | Tragic 53.9% |
| Immigrants | Bosnia and Herzegovina | 5.5 /100 | #223 | Tragic 53.8% |
| Brazilians | 5.3 /100 | #224 | Tragic 53.8% |
| Immigrants | Egypt | 5.2 /100 | #225 | Tragic 53.8% |
| Immigrants | Eastern Africa | 5.1 /100 | #226 | Tragic 53.7% |
| Sudanese | 4.1 /100 | #227 | Tragic 53.6% |
| Alaska Natives | 3.9 /100 | #228 | Tragic 53.6% |
| Immigrants | Turkey | 3.8 /100 | #229 | Tragic 53.6% |
| Immigrants | Nepal | 3.6 /100 | #230 | Tragic 53.5% |
| Panamanians | 3.4 /100 | #231 | Tragic 53.5% |
| Immigrants | Guatemala | 3.2 /100 | #232 | Tragic 53.5% |
Demographics Similar to Marshallese by 2 or more Vehicles in Household
In terms of 2 or more vehicles in household, the demographic groups most similar to Marshallese are Immigrants from Uganda (55.0%, a difference of 0.13%), Peruvian (55.0%, a difference of 0.15%), Eastern European (54.8%, a difference of 0.15%), Russian (54.8%, a difference of 0.21%), and Arab (55.0%, a difference of 0.24%).
| Demographics | Rating | Rank | 2 or more Vehicles in Household |
| Immigrants | Micronesia | 38.2 /100 | #181 | Fair 55.1% |
| Cree | 38.2 /100 | #182 | Fair 55.1% |
| Immigrants | Cameroon | 37.3 /100 | #183 | Fair 55.1% |
| Apache | 36.7 /100 | #184 | Fair 55.1% |
| Arabs | 35.9 /100 | #185 | Fair 55.0% |
| Peruvians | 33.7 /100 | #186 | Fair 55.0% |
| Immigrants | Uganda | 33.4 /100 | #187 | Fair 55.0% |
| Marshallese | 30.5 /100 | #188 | Fair 54.9% |
| Eastern Europeans | 27.5 /100 | #189 | Fair 54.8% |
| Russians | 26.3 /100 | #190 | Fair 54.8% |
| Immigrants | Immigrants | 25.0 /100 | #191 | Fair 54.7% |
| Immigrants | Romania | 23.8 /100 | #192 | Fair 54.7% |
| Immigrants | Japan | 23.4 /100 | #193 | Fair 54.7% |
| Central Americans | 23.0 /100 | #194 | Fair 54.7% |
| Iroquois | 22.6 /100 | #195 | Fair 54.7% |