Immigrants from Albania vs Cape Verdean 2 or more Vehicles in Household
COMPARE
Immigrants from Albania
Cape Verdean
2 or more Vehicles in Household
2 or more Vehicles in Household Comparison
Immigrants from Albania
Cape Verdeans
46.0%
2 OR MORE VEHICLES IN HOUSEHOLD
0.0/ 100
METRIC RATING
318th/ 347
METRIC RANK
46.8%
2 OR MORE VEHICLES IN HOUSEHOLD
0.0/ 100
METRIC RATING
316th/ 347
METRIC RANK
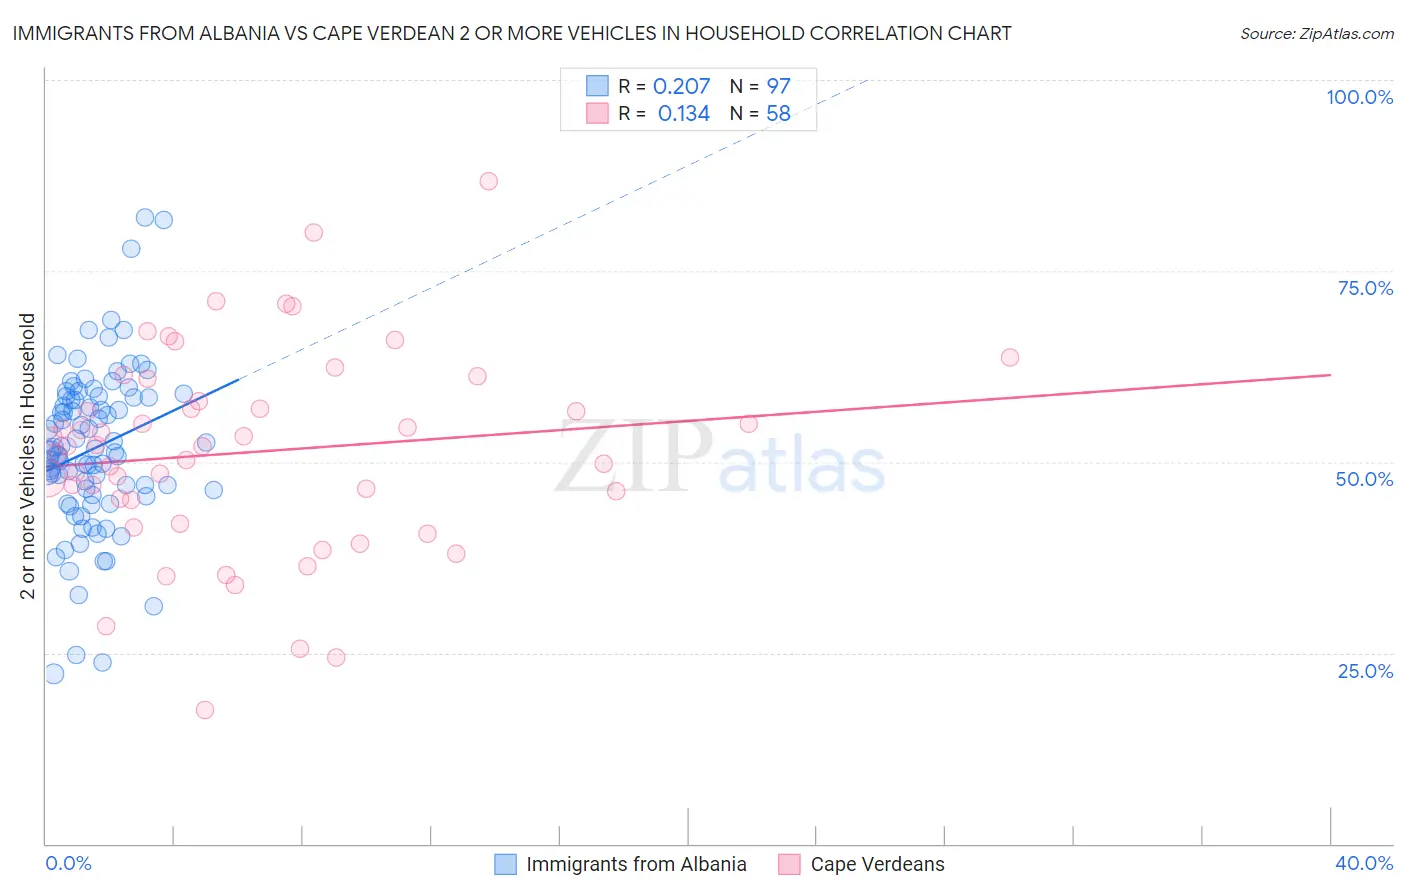
Immigrants from Albania vs Cape Verdean 2 or more Vehicles in Household Correlation Chart
The statistical analysis conducted on geographies consisting of 119,187,610 people shows a weak positive correlation between the proportion of Immigrants from Albania and percentage of households with 2 or more vehicles available in the United States with a correlation coefficient (R) of 0.207 and weighted average of 46.0%. Similarly, the statistical analysis conducted on geographies consisting of 107,560,246 people shows a poor positive correlation between the proportion of Cape Verdeans and percentage of households with 2 or more vehicles available in the United States with a correlation coefficient (R) of 0.134 and weighted average of 46.8%, a difference of 1.7%.
2 or more Vehicles in Household Correlation Summary
| Measurement | Immigrants from Albania | Cape Verdean |
| Minimum | 22.2% | 17.5% |
| Maximum | 82.0% | 86.7% |
| Range | 59.8% | 69.1% |
| Mean | 51.7% | 51.3% |
| Median | 51.5% | 52.1% |
| Interquartile 25% (IQ1) | 46.0% | 45.1% |
| Interquartile 75% (IQ3) | 58.5% | 58.0% |
| Interquartile Range (IQR) | 12.5% | 12.9% |
| Standard Deviation (Sample) | 10.7% | 13.3% |
| Standard Deviation (Population) | 10.7% | 13.1% |
Demographics Similar to Immigrants from Albania and Cape Verdeans by 2 or more Vehicles in Household
In terms of 2 or more vehicles in household, the demographic groups most similar to Immigrants from Albania are Jamaican (45.8%, a difference of 0.52%), Soviet Union (45.7%, a difference of 0.58%), Immigrants from Haiti (46.5%, a difference of 1.1%), Puerto Rican (47.1%, a difference of 2.4%), and Immigrants from Ghana (47.4%, a difference of 3.0%). Similarly, the demographic groups most similar to Cape Verdeans are Immigrants from Haiti (46.5%, a difference of 0.53%), Puerto Rican (47.1%, a difference of 0.69%), Immigrants from Ghana (47.4%, a difference of 1.3%), U.S. Virgin Islander (47.5%, a difference of 1.5%), and Haitian (47.6%, a difference of 1.7%).
| Demographics | Rating | Rank | 2 or more Vehicles in Household |
| Hopi | 0.0 /100 | #307 | Tragic 49.0% |
| Albanians | 0.0 /100 | #308 | Tragic 49.0% |
| Moroccans | 0.0 /100 | #309 | Tragic 48.8% |
| Ghanaians | 0.0 /100 | #310 | Tragic 48.0% |
| Immigrants | Belarus | 0.0 /100 | #311 | Tragic 47.9% |
| Haitians | 0.0 /100 | #312 | Tragic 47.6% |
| U.S. Virgin Islanders | 0.0 /100 | #313 | Tragic 47.5% |
| Immigrants | Ghana | 0.0 /100 | #314 | Tragic 47.4% |
| Puerto Ricans | 0.0 /100 | #315 | Tragic 47.1% |
| Cape Verdeans | 0.0 /100 | #316 | Tragic 46.8% |
| Immigrants | Haiti | 0.0 /100 | #317 | Tragic 46.5% |
| Immigrants | Albania | 0.0 /100 | #318 | Tragic 46.0% |
| Jamaicans | 0.0 /100 | #319 | Tragic 45.8% |
| Soviet Union | 0.0 /100 | #320 | Tragic 45.7% |
| Immigrants | Jamaica | 0.0 /100 | #321 | Tragic 44.5% |
| Senegalese | 0.0 /100 | #322 | Tragic 44.2% |
| Immigrants | Caribbean | 0.0 /100 | #323 | Tragic 44.2% |
| Immigrants | Cabo Verde | 0.0 /100 | #324 | Tragic 43.3% |
| Immigrants | West Indies | 0.0 /100 | #325 | Tragic 43.1% |
| Immigrants | Senegal | 0.0 /100 | #326 | Tragic 43.0% |
| Immigrants | Yemen | 0.0 /100 | #327 | Tragic 42.8% |