Immigrants from Albania vs Cheyenne Family Poverty
COMPARE
Immigrants from Albania
Cheyenne
Family Poverty
Family Poverty Comparison
Immigrants from Albania
Cheyenne
9.0%
FAMILY POVERTY
50.0/ 100
METRIC RATING
174th/ 347
METRIC RANK
14.3%
FAMILY POVERTY
0.0/ 100
METRIC RATING
331st/ 347
METRIC RANK
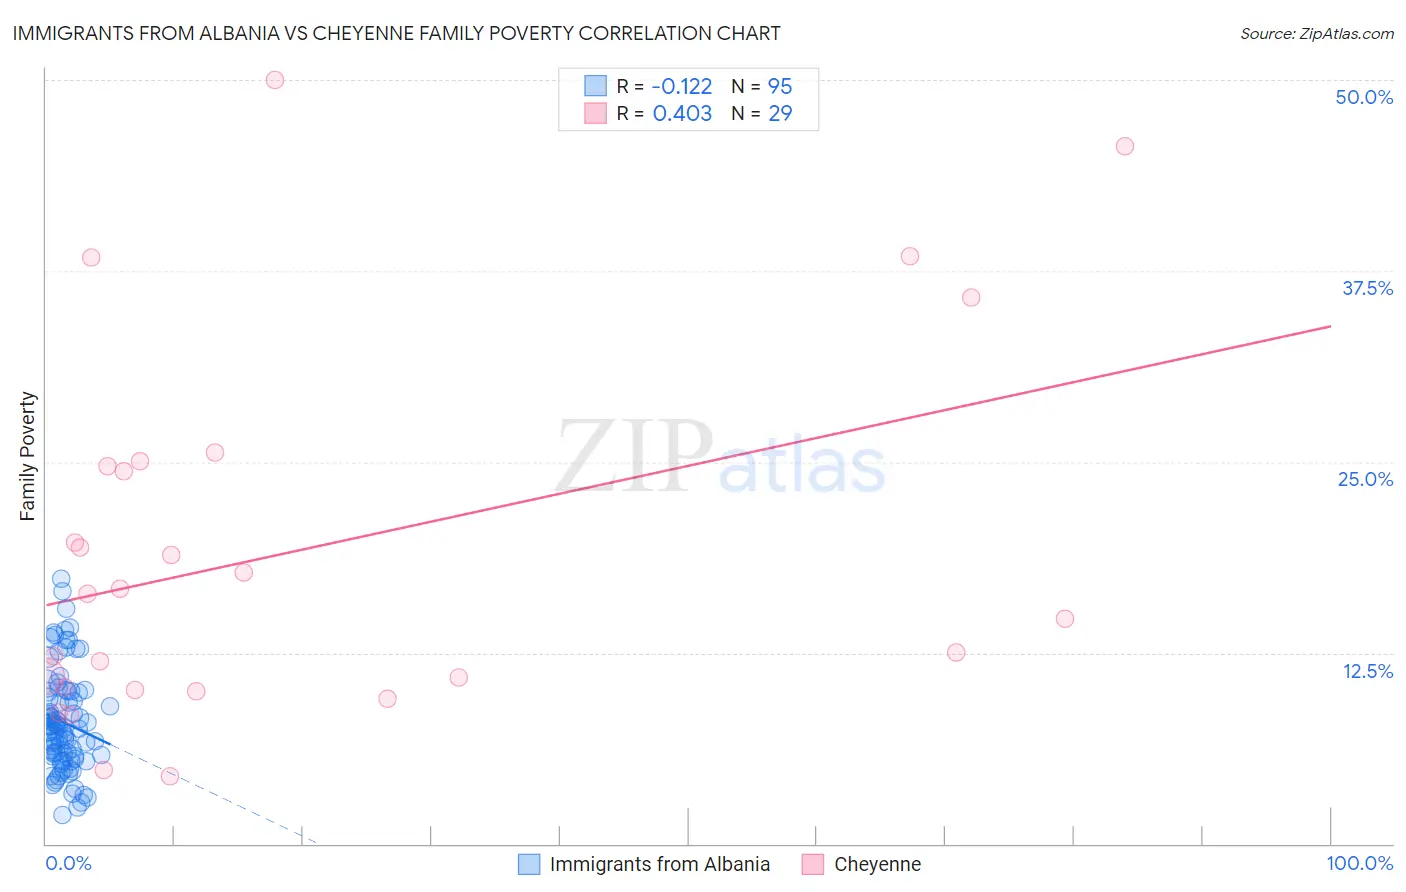
Immigrants from Albania vs Cheyenne Family Poverty Correlation Chart
The statistical analysis conducted on geographies consisting of 119,258,186 people shows a poor negative correlation between the proportion of Immigrants from Albania and poverty level among families in the United States with a correlation coefficient (R) of -0.122 and weighted average of 9.0%. Similarly, the statistical analysis conducted on geographies consisting of 80,652,371 people shows a moderate positive correlation between the proportion of Cheyenne and poverty level among families in the United States with a correlation coefficient (R) of 0.403 and weighted average of 14.3%, a difference of 58.6%.
Family Poverty Correlation Summary
| Measurement | Immigrants from Albania | Cheyenne |
| Minimum | 1.8% | 4.4% |
| Maximum | 17.3% | 50.0% |
| Range | 15.5% | 45.6% |
| Mean | 7.9% | 19.2% |
| Median | 7.5% | 16.4% |
| Interquartile 25% (IQ1) | 5.7% | 10.1% |
| Interquartile 75% (IQ3) | 10.0% | 24.9% |
| Interquartile Range (IQR) | 4.2% | 14.7% |
| Standard Deviation (Sample) | 3.3% | 12.1% |
| Standard Deviation (Population) | 3.3% | 11.9% |
Similar Demographics by Family Poverty
Demographics Similar to Immigrants from Albania by Family Poverty
In terms of family poverty, the demographic groups most similar to Immigrants from Albania are Costa Rican (9.0%, a difference of 0.090%), Immigrants from Syria (9.0%, a difference of 0.33%), Hawaiian (9.0%, a difference of 0.36%), Immigrants from Cameroon (9.0%, a difference of 0.37%), and Immigrants from Iraq (9.1%, a difference of 0.74%).
| Demographics | Rating | Rank | Family Poverty |
| Immigrants | Ethiopia | 62.5 /100 | #167 | Good 8.9% |
| Israelis | 62.1 /100 | #168 | Good 8.9% |
| Immigrants | Chile | 59.6 /100 | #169 | Average 8.9% |
| Kenyans | 58.2 /100 | #170 | Average 8.9% |
| Lebanese | 57.6 /100 | #171 | Average 8.9% |
| Immigrants | Peru | 57.5 /100 | #172 | Average 8.9% |
| Immigrants | Fiji | 56.4 /100 | #173 | Average 8.9% |
| Immigrants | Albania | 50.0 /100 | #174 | Average 9.0% |
| Costa Ricans | 49.3 /100 | #175 | Average 9.0% |
| Immigrants | Syria | 47.5 /100 | #176 | Average 9.0% |
| Hawaiians | 47.2 /100 | #177 | Average 9.0% |
| Immigrants | Cameroon | 47.1 /100 | #178 | Average 9.0% |
| Immigrants | Iraq | 44.4 /100 | #179 | Average 9.1% |
| Immigrants | Uganda | 43.4 /100 | #180 | Average 9.1% |
| Hmong | 40.2 /100 | #181 | Average 9.1% |
Demographics Similar to Cheyenne by Family Poverty
In terms of family poverty, the demographic groups most similar to Cheyenne are Native/Alaskan (14.3%, a difference of 0.14%), Dominican (14.3%, a difference of 0.44%), Immigrants from Dominican Republic (14.4%, a difference of 1.1%), Houma (14.6%, a difference of 2.4%), and Apache (14.7%, a difference of 3.2%).
| Demographics | Rating | Rank | Family Poverty |
| Immigrants | Dominica | 0.0 /100 | #324 | Tragic 12.7% |
| Paiute | 0.0 /100 | #325 | Tragic 13.0% |
| Colville | 0.0 /100 | #326 | Tragic 13.0% |
| Yakama | 0.0 /100 | #327 | Tragic 13.1% |
| Central American Indians | 0.0 /100 | #328 | Tragic 13.3% |
| Blacks/African Americans | 0.0 /100 | #329 | Tragic 13.3% |
| Natives/Alaskans | 0.0 /100 | #330 | Tragic 14.3% |
| Cheyenne | 0.0 /100 | #331 | Tragic 14.3% |
| Dominicans | 0.0 /100 | #332 | Tragic 14.3% |
| Immigrants | Dominican Republic | 0.0 /100 | #333 | Tragic 14.4% |
| Houma | 0.0 /100 | #334 | Tragic 14.6% |
| Apache | 0.0 /100 | #335 | Tragic 14.7% |
| Sioux | 0.0 /100 | #336 | Tragic 15.9% |
| Hopi | 0.0 /100 | #337 | Tragic 15.9% |
| Crow | 0.0 /100 | #338 | Tragic 16.1% |