Immigrants from Africa vs Immigrants from Bahamas 2 or more Vehicles in Household
COMPARE
Immigrants from Africa
Immigrants from Bahamas
2 or more Vehicles in Household
2 or more Vehicles in Household Comparison
Immigrants from Africa
Immigrants from Bahamas
51.8%
2 OR MORE VEHICLES IN HOUSEHOLD
0.2/ 100
METRIC RATING
277th/ 347
METRIC RANK
52.5%
2 OR MORE VEHICLES IN HOUSEHOLD
0.5/ 100
METRIC RATING
260th/ 347
METRIC RANK
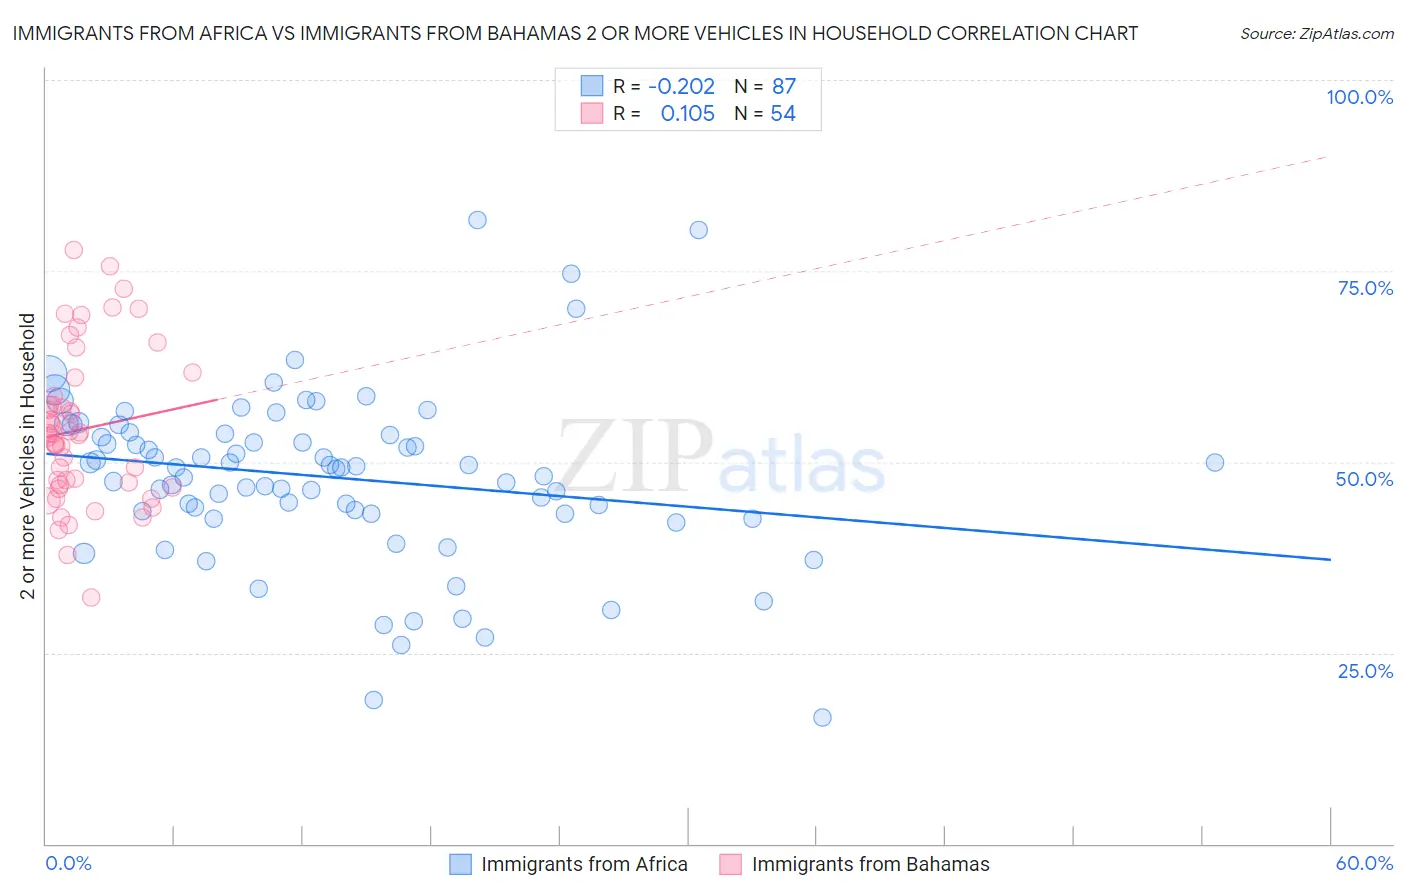
Immigrants from Africa vs Immigrants from Bahamas 2 or more Vehicles in Household Correlation Chart
The statistical analysis conducted on geographies consisting of 468,994,559 people shows a weak negative correlation between the proportion of Immigrants from Africa and percentage of households with 2 or more vehicles available in the United States with a correlation coefficient (R) of -0.202 and weighted average of 51.8%. Similarly, the statistical analysis conducted on geographies consisting of 104,618,237 people shows a poor positive correlation between the proportion of Immigrants from Bahamas and percentage of households with 2 or more vehicles available in the United States with a correlation coefficient (R) of 0.105 and weighted average of 52.5%, a difference of 1.3%.
2 or more Vehicles in Household Correlation Summary
| Measurement | Immigrants from Africa | Immigrants from Bahamas |
| Minimum | 16.4% | 32.3% |
| Maximum | 81.7% | 77.7% |
| Range | 65.2% | 45.4% |
| Mean | 48.0% | 54.3% |
| Median | 49.2% | 53.6% |
| Interquartile 25% (IQ1) | 43.2% | 46.9% |
| Interquartile 75% (IQ3) | 53.7% | 58.5% |
| Interquartile Range (IQR) | 10.5% | 11.6% |
| Standard Deviation (Sample) | 11.3% | 10.0% |
| Standard Deviation (Population) | 11.2% | 9.9% |
Demographics Similar to Immigrants from Africa and Immigrants from Bahamas by 2 or more Vehicles in Household
In terms of 2 or more vehicles in household, the demographic groups most similar to Immigrants from Africa are Immigrants from Croatia (51.8%, a difference of 0.050%), Yuman (51.7%, a difference of 0.060%), Immigrants from Honduras (51.8%, a difference of 0.080%), African (51.8%, a difference of 0.090%), and Israeli (51.9%, a difference of 0.14%). Similarly, the demographic groups most similar to Immigrants from Bahamas are Immigrants from Australia (52.4%, a difference of 0.030%), Alsatian (52.5%, a difference of 0.070%), Central American Indian (52.5%, a difference of 0.10%), Immigrants from Northern Africa (52.3%, a difference of 0.23%), and Immigrants from Southern Europe (52.3%, a difference of 0.36%).
| Demographics | Rating | Rank | 2 or more Vehicles in Household |
| Central American Indians | 0.6 /100 | #258 | Tragic 52.5% |
| Alsatians | 0.6 /100 | #259 | Tragic 52.5% |
| Immigrants | Bahamas | 0.5 /100 | #260 | Tragic 52.5% |
| Immigrants | Australia | 0.5 /100 | #261 | Tragic 52.4% |
| Immigrants | Northern Africa | 0.4 /100 | #262 | Tragic 52.3% |
| Immigrants | Southern Europe | 0.4 /100 | #263 | Tragic 52.3% |
| Immigrants | Latvia | 0.4 /100 | #264 | Tragic 52.2% |
| Immigrants | Congo | 0.3 /100 | #265 | Tragic 52.1% |
| Immigrants | France | 0.2 /100 | #266 | Tragic 52.0% |
| Immigrants | Colombia | 0.2 /100 | #267 | Tragic 52.0% |
| Pima | 0.2 /100 | #268 | Tragic 52.0% |
| Hondurans | 0.2 /100 | #269 | Tragic 52.0% |
| Immigrants | Ireland | 0.2 /100 | #270 | Tragic 52.0% |
| South Americans | 0.2 /100 | #271 | Tragic 51.9% |
| Sub-Saharan Africans | 0.2 /100 | #272 | Tragic 51.9% |
| Israelis | 0.2 /100 | #273 | Tragic 51.9% |
| Africans | 0.2 /100 | #274 | Tragic 51.8% |
| Immigrants | Honduras | 0.2 /100 | #275 | Tragic 51.8% |
| Immigrants | Croatia | 0.2 /100 | #276 | Tragic 51.8% |
| Immigrants | Africa | 0.2 /100 | #277 | Tragic 51.8% |
| Yuman | 0.1 /100 | #278 | Tragic 51.7% |