Immigrants from Africa vs Bermudan 2 or more Vehicles in Household
COMPARE
Immigrants from Africa
Bermudan
2 or more Vehicles in Household
2 or more Vehicles in Household Comparison
Immigrants from Africa
Bermudans
51.8%
2 OR MORE VEHICLES IN HOUSEHOLD
0.2/ 100
METRIC RATING
277th/ 347
METRIC RANK
50.6%
2 OR MORE VEHICLES IN HOUSEHOLD
0.0/ 100
METRIC RATING
294th/ 347
METRIC RANK
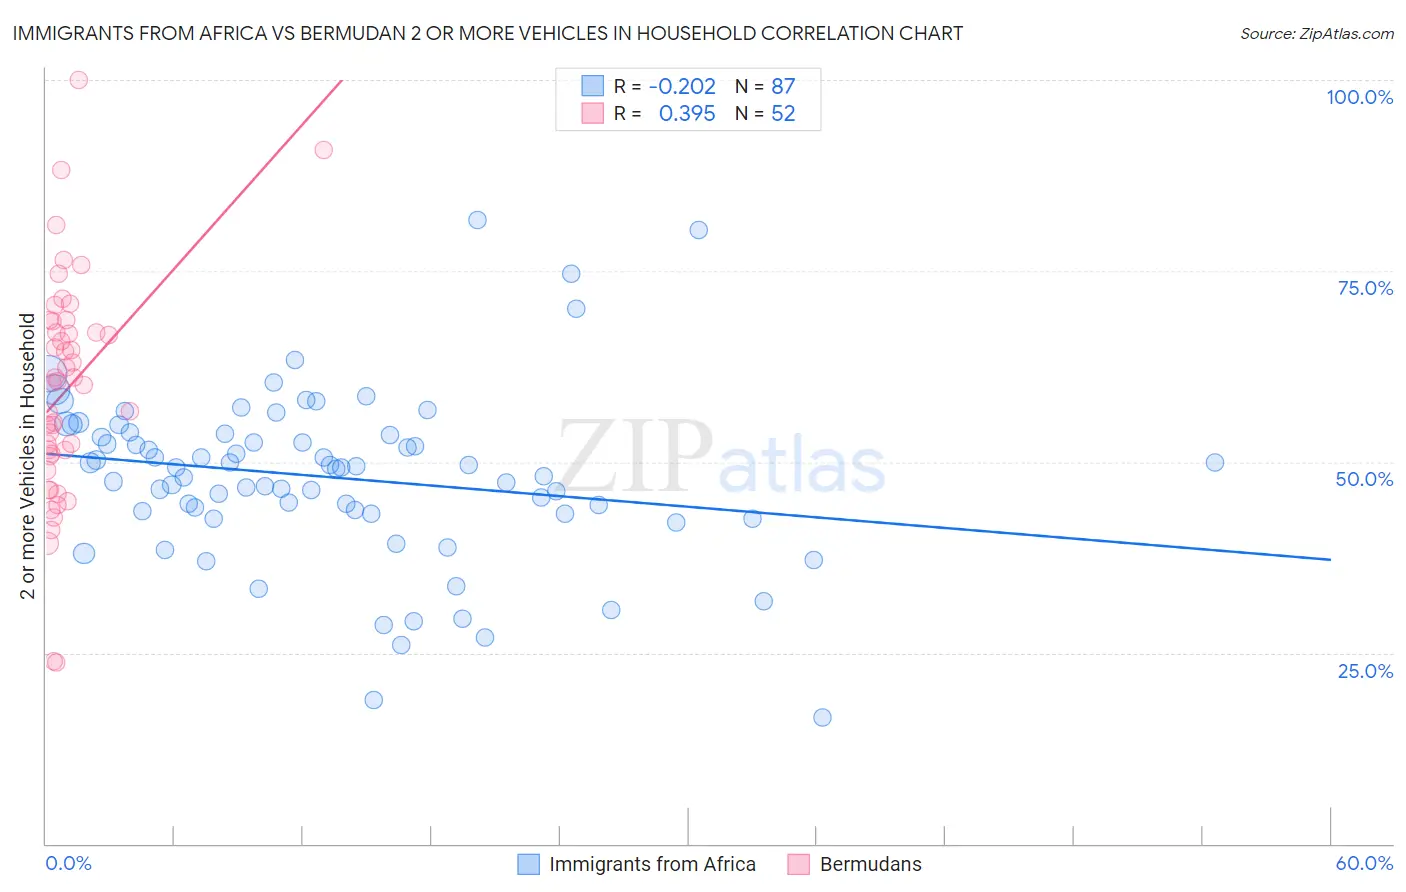
Immigrants from Africa vs Bermudan 2 or more Vehicles in Household Correlation Chart
The statistical analysis conducted on geographies consisting of 468,994,559 people shows a weak negative correlation between the proportion of Immigrants from Africa and percentage of households with 2 or more vehicles available in the United States with a correlation coefficient (R) of -0.202 and weighted average of 51.8%. Similarly, the statistical analysis conducted on geographies consisting of 55,716,623 people shows a mild positive correlation between the proportion of Bermudans and percentage of households with 2 or more vehicles available in the United States with a correlation coefficient (R) of 0.395 and weighted average of 50.6%, a difference of 2.3%.
2 or more Vehicles in Household Correlation Summary
| Measurement | Immigrants from Africa | Bermudan |
| Minimum | 16.4% | 23.7% |
| Maximum | 81.7% | 100.0% |
| Range | 65.2% | 76.3% |
| Mean | 48.0% | 59.5% |
| Median | 49.2% | 60.5% |
| Interquartile 25% (IQ1) | 43.2% | 50.9% |
| Interquartile 75% (IQ3) | 53.7% | 67.6% |
| Interquartile Range (IQR) | 10.5% | 16.8% |
| Standard Deviation (Sample) | 11.3% | 14.7% |
| Standard Deviation (Population) | 11.2% | 14.6% |
Demographics Similar to Immigrants from Africa and Bermudans by 2 or more Vehicles in Household
In terms of 2 or more vehicles in household, the demographic groups most similar to Immigrants from Africa are Immigrants from Croatia (51.8%, a difference of 0.050%), Yuman (51.7%, a difference of 0.060%), Liberian (51.7%, a difference of 0.070%), Immigrants from Honduras (51.8%, a difference of 0.080%), and Immigrants from Eastern Europe (51.7%, a difference of 0.11%). Similarly, the demographic groups most similar to Bermudans are Cypriot (50.6%, a difference of 0.070%), Immigrants from Ukraine (50.9%, a difference of 0.56%), Black/African American (50.9%, a difference of 0.56%), Belizean (51.0%, a difference of 0.90%), and Immigrants from Panama (51.1%, a difference of 0.93%).
| Demographics | Rating | Rank | 2 or more Vehicles in Household |
| Immigrants | Honduras | 0.2 /100 | #275 | Tragic 51.8% |
| Immigrants | Croatia | 0.2 /100 | #276 | Tragic 51.8% |
| Immigrants | Africa | 0.2 /100 | #277 | Tragic 51.8% |
| Yuman | 0.1 /100 | #278 | Tragic 51.7% |
| Liberians | 0.1 /100 | #279 | Tragic 51.7% |
| Immigrants | Eastern Europe | 0.1 /100 | #280 | Tragic 51.7% |
| Immigrants | Kazakhstan | 0.1 /100 | #281 | Tragic 51.6% |
| Bahamians | 0.1 /100 | #282 | Tragic 51.5% |
| Immigrants | China | 0.1 /100 | #283 | Tragic 51.5% |
| Immigrants | Zaire | 0.1 /100 | #284 | Tragic 51.5% |
| Immigrants | Uruguay | 0.1 /100 | #285 | Tragic 51.4% |
| Immigrants | Liberia | 0.1 /100 | #286 | Tragic 51.3% |
| Immigrants | Serbia | 0.1 /100 | #287 | Tragic 51.3% |
| Okinawans | 0.1 /100 | #288 | Tragic 51.2% |
| Somalis | 0.0 /100 | #289 | Tragic 51.1% |
| Immigrants | Panama | 0.0 /100 | #290 | Tragic 51.1% |
| Belizeans | 0.0 /100 | #291 | Tragic 51.0% |
| Immigrants | Ukraine | 0.0 /100 | #292 | Tragic 50.9% |
| Blacks/African Americans | 0.0 /100 | #293 | Tragic 50.9% |
| Bermudans | 0.0 /100 | #294 | Tragic 50.6% |
| Cypriots | 0.0 /100 | #295 | Tragic 50.6% |