Immigrants from Africa vs Pennsylvania German 2 or more Vehicles in Household
COMPARE
Immigrants from Africa
Pennsylvania German
2 or more Vehicles in Household
2 or more Vehicles in Household Comparison
Immigrants from Africa
Pennsylvania Germans
51.8%
2 OR MORE VEHICLES IN HOUSEHOLD
0.2/ 100
METRIC RATING
277th/ 347
METRIC RANK
58.5%
2 OR MORE VEHICLES IN HOUSEHOLD
99.7/ 100
METRIC RATING
69th/ 347
METRIC RANK
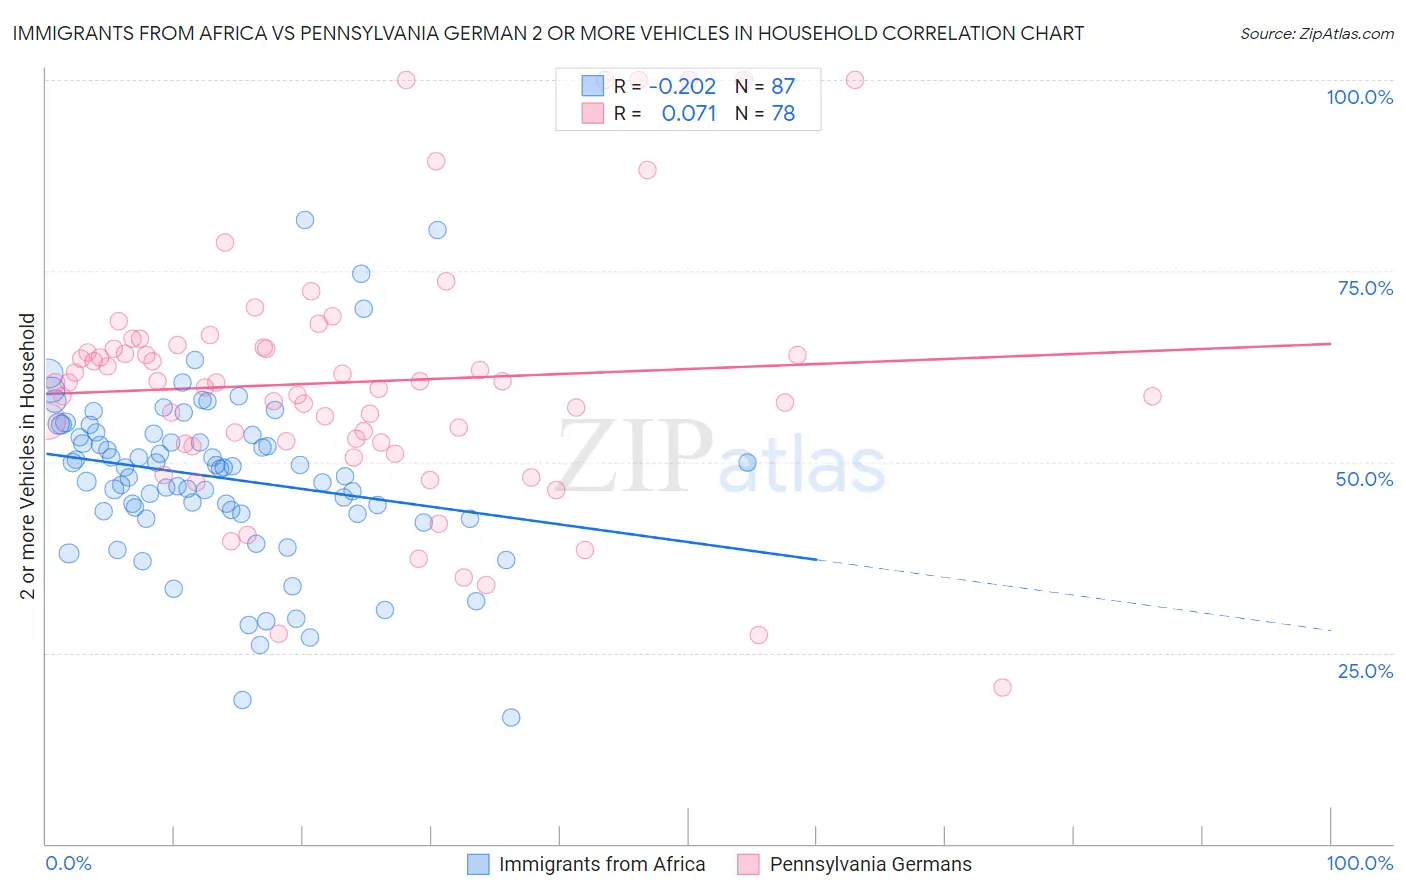
Immigrants from Africa vs Pennsylvania German 2 or more Vehicles in Household Correlation Chart
The statistical analysis conducted on geographies consisting of 468,994,559 people shows a weak negative correlation between the proportion of Immigrants from Africa and percentage of households with 2 or more vehicles available in the United States with a correlation coefficient (R) of -0.202 and weighted average of 51.8%. Similarly, the statistical analysis conducted on geographies consisting of 234,072,378 people shows a slight positive correlation between the proportion of Pennsylvania Germans and percentage of households with 2 or more vehicles available in the United States with a correlation coefficient (R) of 0.071 and weighted average of 58.5%, a difference of 13.0%.
2 or more Vehicles in Household Correlation Summary
| Measurement | Immigrants from Africa | Pennsylvania German |
| Minimum | 16.4% | 20.5% |
| Maximum | 81.7% | 100.0% |
| Range | 65.2% | 79.5% |
| Mean | 48.0% | 60.4% |
| Median | 49.2% | 60.3% |
| Interquartile 25% (IQ1) | 43.2% | 52.6% |
| Interquartile 75% (IQ3) | 53.7% | 65.0% |
| Interquartile Range (IQR) | 10.5% | 12.4% |
| Standard Deviation (Sample) | 11.3% | 16.6% |
| Standard Deviation (Population) | 11.2% | 16.5% |
Similar Demographics by 2 or more Vehicles in Household
Demographics Similar to Immigrants from Africa by 2 or more Vehicles in Household
In terms of 2 or more vehicles in household, the demographic groups most similar to Immigrants from Africa are Immigrants from Croatia (51.8%, a difference of 0.050%), Yuman (51.7%, a difference of 0.060%), Liberian (51.7%, a difference of 0.070%), Immigrants from Honduras (51.8%, a difference of 0.080%), and African (51.8%, a difference of 0.090%).
| Demographics | Rating | Rank | 2 or more Vehicles in Household |
| Immigrants | Ireland | 0.2 /100 | #270 | Tragic 52.0% |
| South Americans | 0.2 /100 | #271 | Tragic 51.9% |
| Sub-Saharan Africans | 0.2 /100 | #272 | Tragic 51.9% |
| Israelis | 0.2 /100 | #273 | Tragic 51.9% |
| Africans | 0.2 /100 | #274 | Tragic 51.8% |
| Immigrants | Honduras | 0.2 /100 | #275 | Tragic 51.8% |
| Immigrants | Croatia | 0.2 /100 | #276 | Tragic 51.8% |
| Immigrants | Africa | 0.2 /100 | #277 | Tragic 51.8% |
| Yuman | 0.1 /100 | #278 | Tragic 51.7% |
| Liberians | 0.1 /100 | #279 | Tragic 51.7% |
| Immigrants | Eastern Europe | 0.1 /100 | #280 | Tragic 51.7% |
| Immigrants | Kazakhstan | 0.1 /100 | #281 | Tragic 51.6% |
| Bahamians | 0.1 /100 | #282 | Tragic 51.5% |
| Immigrants | China | 0.1 /100 | #283 | Tragic 51.5% |
| Immigrants | Zaire | 0.1 /100 | #284 | Tragic 51.5% |
Demographics Similar to Pennsylvania Germans by 2 or more Vehicles in Household
In terms of 2 or more vehicles in household, the demographic groups most similar to Pennsylvania Germans are Italian (58.4%, a difference of 0.11%), Canadian (58.6%, a difference of 0.12%), Laotian (58.6%, a difference of 0.13%), Bangladeshi (58.4%, a difference of 0.14%), and Croatian (58.6%, a difference of 0.15%).
| Demographics | Rating | Rank | 2 or more Vehicles in Household |
| Immigrants | Nonimmigrants | 99.8 /100 | #62 | Exceptional 58.8% |
| Mexican American Indians | 99.8 /100 | #63 | Exceptional 58.7% |
| Portuguese | 99.7 /100 | #64 | Exceptional 58.6% |
| Immigrants | Central America | 99.7 /100 | #65 | Exceptional 58.6% |
| Croatians | 99.7 /100 | #66 | Exceptional 58.6% |
| Laotians | 99.7 /100 | #67 | Exceptional 58.6% |
| Canadians | 99.7 /100 | #68 | Exceptional 58.6% |
| Pennsylvania Germans | 99.7 /100 | #69 | Exceptional 58.5% |
| Italians | 99.6 /100 | #70 | Exceptional 58.4% |
| Bangladeshis | 99.6 /100 | #71 | Exceptional 58.4% |
| Austrians | 99.6 /100 | #72 | Exceptional 58.4% |
| Bolivians | 99.6 /100 | #73 | Exceptional 58.3% |
| Immigrants | Afghanistan | 99.6 /100 | #74 | Exceptional 58.3% |
| Poles | 99.5 /100 | #75 | Exceptional 58.3% |
| Creek | 99.5 /100 | #76 | Exceptional 58.3% |