Guatemalan vs Immigrants from Bahamas 2 or more Vehicles in Household
COMPARE
Guatemalan
Immigrants from Bahamas
2 or more Vehicles in Household
2 or more Vehicles in Household Comparison
Guatemalans
Immigrants from Bahamas
54.1%
2 OR MORE VEHICLES IN HOUSEHOLD
9.6/ 100
METRIC RATING
213th/ 347
METRIC RANK
52.5%
2 OR MORE VEHICLES IN HOUSEHOLD
0.5/ 100
METRIC RATING
260th/ 347
METRIC RANK
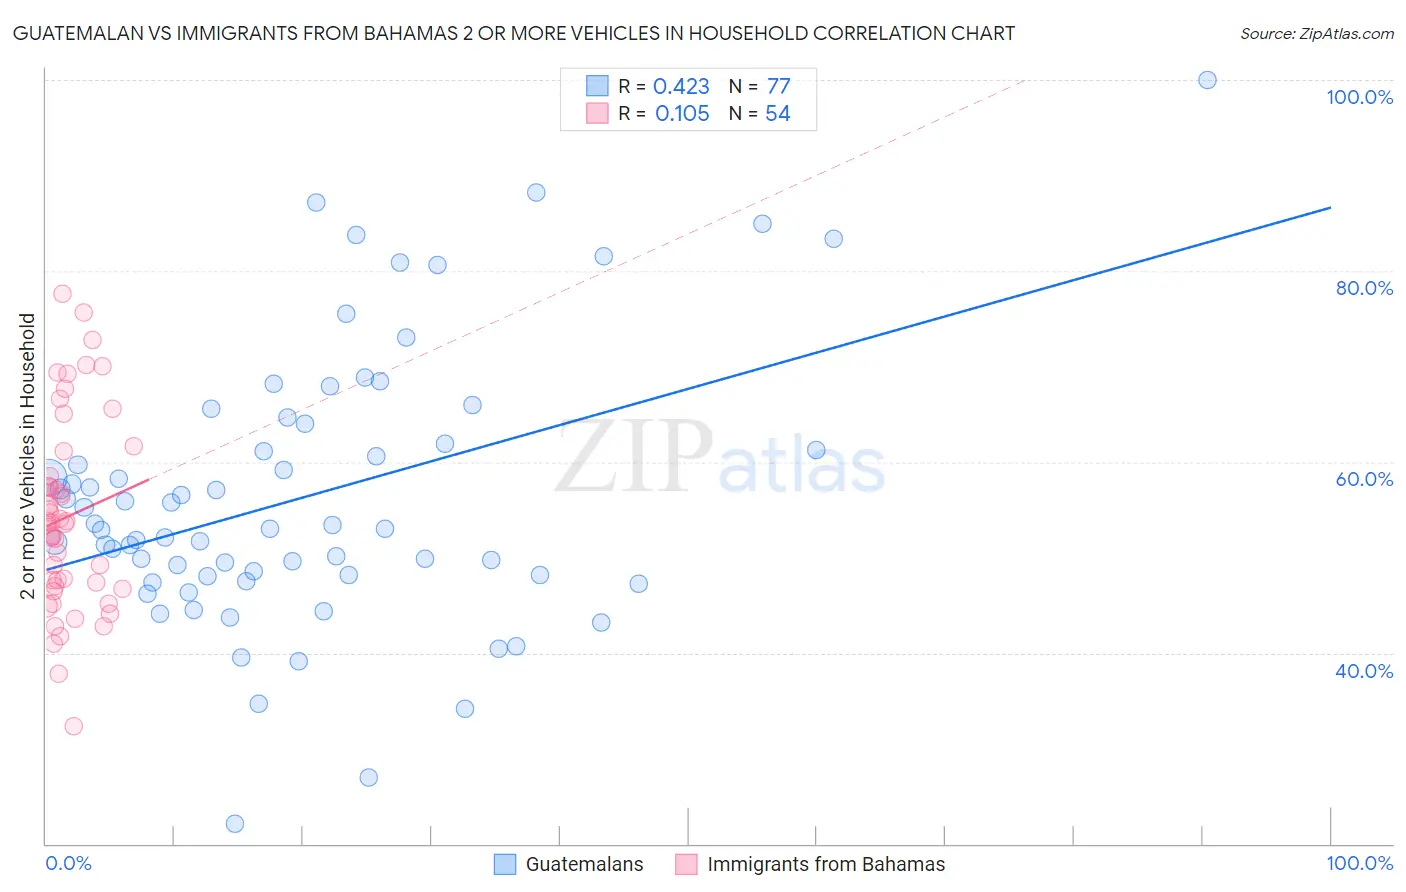
Guatemalan vs Immigrants from Bahamas 2 or more Vehicles in Household Correlation Chart
The statistical analysis conducted on geographies consisting of 409,337,767 people shows a moderate positive correlation between the proportion of Guatemalans and percentage of households with 2 or more vehicles available in the United States with a correlation coefficient (R) of 0.423 and weighted average of 54.1%. Similarly, the statistical analysis conducted on geographies consisting of 104,618,237 people shows a poor positive correlation between the proportion of Immigrants from Bahamas and percentage of households with 2 or more vehicles available in the United States with a correlation coefficient (R) of 0.105 and weighted average of 52.5%, a difference of 3.2%.
2 or more Vehicles in Household Correlation Summary
| Measurement | Guatemalan | Immigrants from Bahamas |
| Minimum | 22.0% | 32.3% |
| Maximum | 100.0% | 77.7% |
| Range | 78.0% | 45.4% |
| Mean | 56.4% | 54.3% |
| Median | 53.1% | 53.6% |
| Interquartile 25% (IQ1) | 48.1% | 46.9% |
| Interquartile 75% (IQ3) | 63.0% | 58.5% |
| Interquartile Range (IQR) | 14.9% | 11.6% |
| Standard Deviation (Sample) | 14.4% | 10.0% |
| Standard Deviation (Population) | 14.3% | 9.9% |
Similar Demographics by 2 or more Vehicles in Household
Demographics Similar to Guatemalans by 2 or more Vehicles in Household
In terms of 2 or more vehicles in household, the demographic groups most similar to Guatemalans are Immigrants from Czechoslovakia (54.1%, a difference of 0.020%), Aleut (54.1%, a difference of 0.030%), Immigrants from Western Asia (54.1%, a difference of 0.040%), Immigrants from Chile (54.2%, a difference of 0.16%), and Immigrants from Saudi Arabia (54.2%, a difference of 0.19%).
| Demographics | Rating | Rank | 2 or more Vehicles in Household |
| Immigrants | Latin America | 13.1 /100 | #206 | Poor 54.3% |
| Turks | 13.0 /100 | #207 | Poor 54.3% |
| Egyptians | 12.0 /100 | #208 | Poor 54.3% |
| Immigrants | Bulgaria | 12.0 /100 | #209 | Poor 54.3% |
| Immigrants | Saudi Arabia | 11.3 /100 | #210 | Poor 54.2% |
| Immigrants | Hungary | 11.3 /100 | #211 | Poor 54.2% |
| Immigrants | Chile | 11.1 /100 | #212 | Poor 54.2% |
| Guatemalans | 9.6 /100 | #213 | Tragic 54.1% |
| Immigrants | Czechoslovakia | 9.4 /100 | #214 | Tragic 54.1% |
| Aleuts | 9.3 /100 | #215 | Tragic 54.1% |
| Immigrants | Western Asia | 9.3 /100 | #216 | Tragic 54.1% |
| Immigrants | Burma/Myanmar | 7.1 /100 | #217 | Tragic 53.9% |
| Immigrants | Argentina | 6.8 /100 | #218 | Tragic 53.9% |
| South American Indians | 6.5 /100 | #219 | Tragic 53.9% |
| Taiwanese | 6.3 /100 | #220 | Tragic 53.9% |
Demographics Similar to Immigrants from Bahamas by 2 or more Vehicles in Household
In terms of 2 or more vehicles in household, the demographic groups most similar to Immigrants from Bahamas are Immigrants from Australia (52.4%, a difference of 0.030%), Alsatian (52.5%, a difference of 0.070%), Central American Indian (52.5%, a difference of 0.10%), Immigrants from Hong Kong (52.6%, a difference of 0.20%), and Immigrants from Northern Africa (52.3%, a difference of 0.23%).
| Demographics | Rating | Rank | 2 or more Vehicles in Household |
| Nigerians | 0.9 /100 | #253 | Tragic 52.8% |
| Immigrants | Malaysia | 0.8 /100 | #254 | Tragic 52.7% |
| Uruguayans | 0.7 /100 | #255 | Tragic 52.7% |
| Immigrants | Eritrea | 0.7 /100 | #256 | Tragic 52.6% |
| Immigrants | Hong Kong | 0.6 /100 | #257 | Tragic 52.6% |
| Central American Indians | 0.6 /100 | #258 | Tragic 52.5% |
| Alsatians | 0.6 /100 | #259 | Tragic 52.5% |
| Immigrants | Bahamas | 0.5 /100 | #260 | Tragic 52.5% |
| Immigrants | Australia | 0.5 /100 | #261 | Tragic 52.4% |
| Immigrants | Northern Africa | 0.4 /100 | #262 | Tragic 52.3% |
| Immigrants | Southern Europe | 0.4 /100 | #263 | Tragic 52.3% |
| Immigrants | Latvia | 0.4 /100 | #264 | Tragic 52.2% |
| Immigrants | Congo | 0.3 /100 | #265 | Tragic 52.1% |
| Immigrants | France | 0.2 /100 | #266 | Tragic 52.0% |
| Immigrants | Colombia | 0.2 /100 | #267 | Tragic 52.0% |