Immigrants from Sri Lanka vs Immigrants from Bahamas 2 or more Vehicles in Household
COMPARE
Immigrants from Sri Lanka
Immigrants from Bahamas
2 or more Vehicles in Household
2 or more Vehicles in Household Comparison
Immigrants from Sri Lanka
Immigrants from Bahamas
55.5%
2 OR MORE VEHICLES IN HOUSEHOLD
58.3/ 100
METRIC RATING
166th/ 347
METRIC RANK
52.5%
2 OR MORE VEHICLES IN HOUSEHOLD
0.5/ 100
METRIC RATING
260th/ 347
METRIC RANK
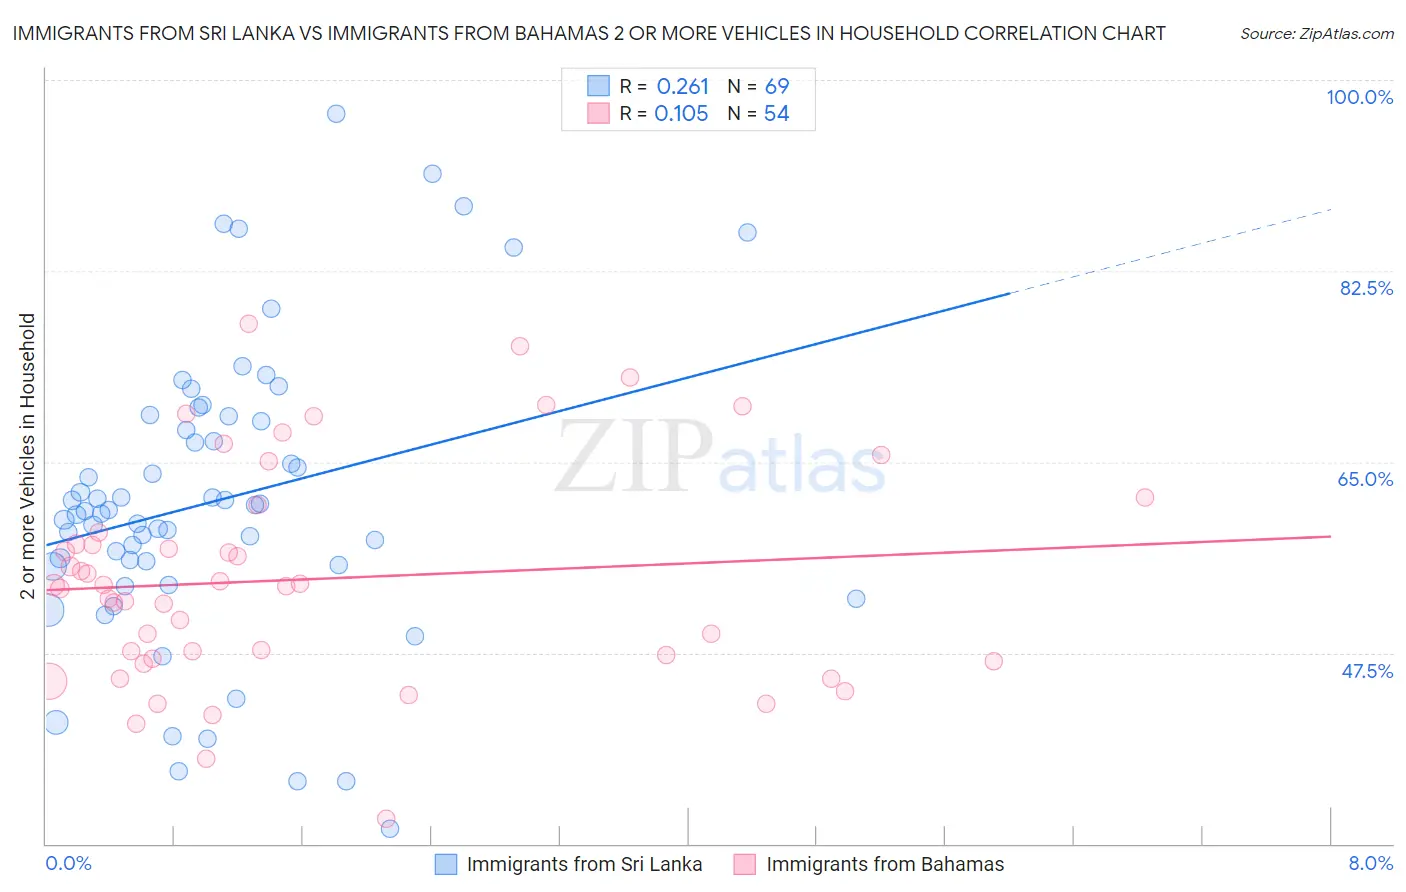
Immigrants from Sri Lanka vs Immigrants from Bahamas 2 or more Vehicles in Household Correlation Chart
The statistical analysis conducted on geographies consisting of 149,689,488 people shows a weak positive correlation between the proportion of Immigrants from Sri Lanka and percentage of households with 2 or more vehicles available in the United States with a correlation coefficient (R) of 0.261 and weighted average of 55.5%. Similarly, the statistical analysis conducted on geographies consisting of 104,618,237 people shows a poor positive correlation between the proportion of Immigrants from Bahamas and percentage of households with 2 or more vehicles available in the United States with a correlation coefficient (R) of 0.105 and weighted average of 52.5%, a difference of 5.9%.
2 or more Vehicles in Household Correlation Summary
| Measurement | Immigrants from Sri Lanka | Immigrants from Bahamas |
| Minimum | 31.3% | 32.3% |
| Maximum | 96.9% | 77.7% |
| Range | 65.5% | 45.4% |
| Mean | 61.4% | 54.3% |
| Median | 60.5% | 53.6% |
| Interquartile 25% (IQ1) | 55.5% | 46.9% |
| Interquartile 75% (IQ3) | 69.0% | 58.5% |
| Interquartile Range (IQR) | 13.5% | 11.6% |
| Standard Deviation (Sample) | 13.5% | 10.0% |
| Standard Deviation (Population) | 13.4% | 9.9% |
Similar Demographics by 2 or more Vehicles in Household
Demographics Similar to Immigrants from Sri Lanka by 2 or more Vehicles in Household
In terms of 2 or more vehicles in household, the demographic groups most similar to Immigrants from Sri Lanka are Kenyan (55.5%, a difference of 0.010%), Immigrants from El Salvador (55.6%, a difference of 0.040%), Dutch West Indian (55.6%, a difference of 0.060%), French American Indian (55.5%, a difference of 0.070%), and Immigrants from Zimbabwe (55.6%, a difference of 0.080%).
| Demographics | Rating | Rank | 2 or more Vehicles in Household |
| Paiute | 68.0 /100 | #159 | Good 55.8% |
| Crow | 67.0 /100 | #160 | Good 55.7% |
| Colville | 61.1 /100 | #161 | Good 55.6% |
| German Russians | 60.9 /100 | #162 | Good 55.6% |
| Immigrants | Zimbabwe | 60.2 /100 | #163 | Good 55.6% |
| Dutch West Indians | 59.8 /100 | #164 | Average 55.6% |
| Immigrants | El Salvador | 59.4 /100 | #165 | Average 55.6% |
| Immigrants | Sri Lanka | 58.3 /100 | #166 | Average 55.5% |
| Kenyans | 58.1 /100 | #167 | Average 55.5% |
| French American Indians | 56.7 /100 | #168 | Average 55.5% |
| Immigrants | Austria | 56.3 /100 | #169 | Average 55.5% |
| Romanians | 55.8 /100 | #170 | Average 55.5% |
| Immigrants | Costa Rica | 54.4 /100 | #171 | Average 55.4% |
| Immigrants | Nicaragua | 51.6 /100 | #172 | Average 55.4% |
| Immigrants | Western Europe | 51.4 /100 | #173 | Average 55.4% |
Demographics Similar to Immigrants from Bahamas by 2 or more Vehicles in Household
In terms of 2 or more vehicles in household, the demographic groups most similar to Immigrants from Bahamas are Immigrants from Australia (52.4%, a difference of 0.030%), Alsatian (52.5%, a difference of 0.070%), Central American Indian (52.5%, a difference of 0.10%), Immigrants from Hong Kong (52.6%, a difference of 0.20%), and Immigrants from Northern Africa (52.3%, a difference of 0.23%).
| Demographics | Rating | Rank | 2 or more Vehicles in Household |
| Nigerians | 0.9 /100 | #253 | Tragic 52.8% |
| Immigrants | Malaysia | 0.8 /100 | #254 | Tragic 52.7% |
| Uruguayans | 0.7 /100 | #255 | Tragic 52.7% |
| Immigrants | Eritrea | 0.7 /100 | #256 | Tragic 52.6% |
| Immigrants | Hong Kong | 0.6 /100 | #257 | Tragic 52.6% |
| Central American Indians | 0.6 /100 | #258 | Tragic 52.5% |
| Alsatians | 0.6 /100 | #259 | Tragic 52.5% |
| Immigrants | Bahamas | 0.5 /100 | #260 | Tragic 52.5% |
| Immigrants | Australia | 0.5 /100 | #261 | Tragic 52.4% |
| Immigrants | Northern Africa | 0.4 /100 | #262 | Tragic 52.3% |
| Immigrants | Southern Europe | 0.4 /100 | #263 | Tragic 52.3% |
| Immigrants | Latvia | 0.4 /100 | #264 | Tragic 52.2% |
| Immigrants | Congo | 0.3 /100 | #265 | Tragic 52.1% |
| Immigrants | France | 0.2 /100 | #266 | Tragic 52.0% |
| Immigrants | Colombia | 0.2 /100 | #267 | Tragic 52.0% |