Immigrants from Afghanistan vs Nepalese 3 or more Vehicles in Household
COMPARE
Immigrants from Afghanistan
Nepalese
3 or more Vehicles in Household
3 or more Vehicles in Household Comparison
Immigrants from Afghanistan
Nepalese
21.2%
3 OR MORE VEHICLES IN HOUSEHOLD
99.1/ 100
METRIC RATING
90th/ 347
METRIC RANK
24.9%
3 OR MORE VEHICLES IN HOUSEHOLD
100.0/ 100
METRIC RATING
10th/ 347
METRIC RANK
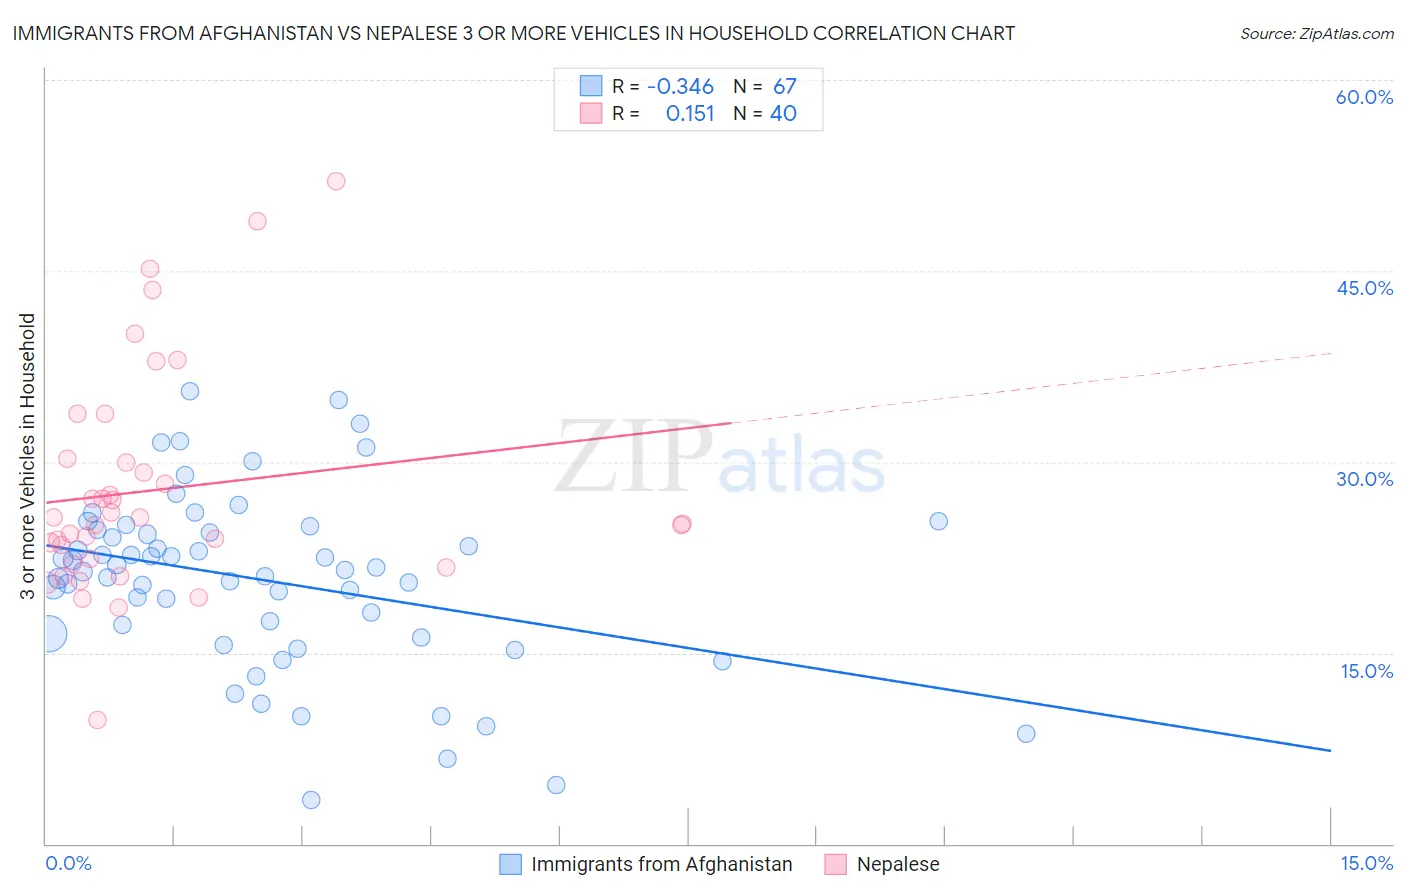
Immigrants from Afghanistan vs Nepalese 3 or more Vehicles in Household Correlation Chart
The statistical analysis conducted on geographies consisting of 147,579,076 people shows a mild negative correlation between the proportion of Immigrants from Afghanistan and percentage of households with 3 or more vehicles available in the United States with a correlation coefficient (R) of -0.346 and weighted average of 21.2%. Similarly, the statistical analysis conducted on geographies consisting of 24,521,755 people shows a poor positive correlation between the proportion of Nepalese and percentage of households with 3 or more vehicles available in the United States with a correlation coefficient (R) of 0.151 and weighted average of 24.9%, a difference of 17.3%.
3 or more Vehicles in Household Correlation Summary
| Measurement | Immigrants from Afghanistan | Nepalese |
| Minimum | 3.4% | 9.8% |
| Maximum | 35.6% | 52.0% |
| Range | 32.2% | 42.3% |
| Mean | 20.7% | 27.8% |
| Median | 21.5% | 25.4% |
| Interquartile 25% (IQ1) | 16.5% | 22.2% |
| Interquartile 75% (IQ3) | 24.6% | 30.1% |
| Interquartile Range (IQR) | 8.1% | 7.9% |
| Standard Deviation (Sample) | 6.9% | 8.8% |
| Standard Deviation (Population) | 6.8% | 8.7% |
Similar Demographics by 3 or more Vehicles in Household
Demographics Similar to Immigrants from Afghanistan by 3 or more Vehicles in Household
In terms of 3 or more vehicles in household, the demographic groups most similar to Immigrants from Afghanistan are Marshallese (21.3%, a difference of 0.22%), Belgian (21.2%, a difference of 0.33%), Apache (21.2%, a difference of 0.41%), Immigrants from Indonesia (21.1%, a difference of 0.61%), and French (21.4%, a difference of 0.78%).
| Demographics | Rating | Rank | 3 or more Vehicles in Household |
| Chippewa | 99.6 /100 | #83 | Exceptional 21.5% |
| Icelanders | 99.6 /100 | #84 | Exceptional 21.5% |
| Laotians | 99.6 /100 | #85 | Exceptional 21.5% |
| Delaware | 99.6 /100 | #86 | Exceptional 21.5% |
| Immigrants | Azores | 99.5 /100 | #87 | Exceptional 21.5% |
| French | 99.4 /100 | #88 | Exceptional 21.4% |
| Marshallese | 99.2 /100 | #89 | Exceptional 21.3% |
| Immigrants | Afghanistan | 99.1 /100 | #90 | Exceptional 21.2% |
| Belgians | 98.9 /100 | #91 | Exceptional 21.2% |
| Apache | 98.9 /100 | #92 | Exceptional 21.2% |
| Immigrants | Indonesia | 98.8 /100 | #93 | Exceptional 21.1% |
| Immigrants | Cambodia | 98.6 /100 | #94 | Exceptional 21.1% |
| Pakistanis | 98.5 /100 | #95 | Exceptional 21.0% |
| Cree | 98.4 /100 | #96 | Exceptional 21.0% |
| Canadians | 98.3 /100 | #97 | Exceptional 21.0% |
Demographics Similar to Nepalese by 3 or more Vehicles in Household
In terms of 3 or more vehicles in household, the demographic groups most similar to Nepalese are Native Hawaiian (24.9%, a difference of 0.090%), Shoshone (24.9%, a difference of 0.10%), Samoan (25.0%, a difference of 0.19%), Danish (24.7%, a difference of 0.79%), and Mexican (24.7%, a difference of 0.87%).
| Demographics | Rating | Rank | 3 or more Vehicles in Household |
| Tongans | 100.0 /100 | #3 | Exceptional 26.5% |
| Arapaho | 100.0 /100 | #4 | Exceptional 26.4% |
| Puget Sound Salish | 100.0 /100 | #5 | Exceptional 26.4% |
| Immigrants | Fiji | 100.0 /100 | #6 | Exceptional 26.1% |
| Colville | 100.0 /100 | #7 | Exceptional 25.8% |
| Samoans | 100.0 /100 | #8 | Exceptional 25.0% |
| Native Hawaiians | 100.0 /100 | #9 | Exceptional 24.9% |
| Nepalese | 100.0 /100 | #10 | Exceptional 24.9% |
| Shoshone | 100.0 /100 | #11 | Exceptional 24.9% |
| Danes | 100.0 /100 | #12 | Exceptional 24.7% |
| Mexicans | 100.0 /100 | #13 | Exceptional 24.7% |
| Immigrants | Mexico | 100.0 /100 | #14 | Exceptional 24.6% |
| Hawaiians | 100.0 /100 | #15 | Exceptional 24.3% |
| Basques | 100.0 /100 | #16 | Exceptional 24.3% |
| Koreans | 100.0 /100 | #17 | Exceptional 24.1% |