Mexican vs Immigrants from Ghana 2 or more Vehicles in Household
COMPARE
Mexican
Immigrants from Ghana
2 or more Vehicles in Household
2 or more Vehicles in Household Comparison
Mexicans
Immigrants from Ghana
61.7%
2 OR MORE VEHICLES IN HOUSEHOLD
100.0/ 100
METRIC RATING
10th/ 347
METRIC RANK
47.4%
2 OR MORE VEHICLES IN HOUSEHOLD
0.0/ 100
METRIC RATING
314th/ 347
METRIC RANK
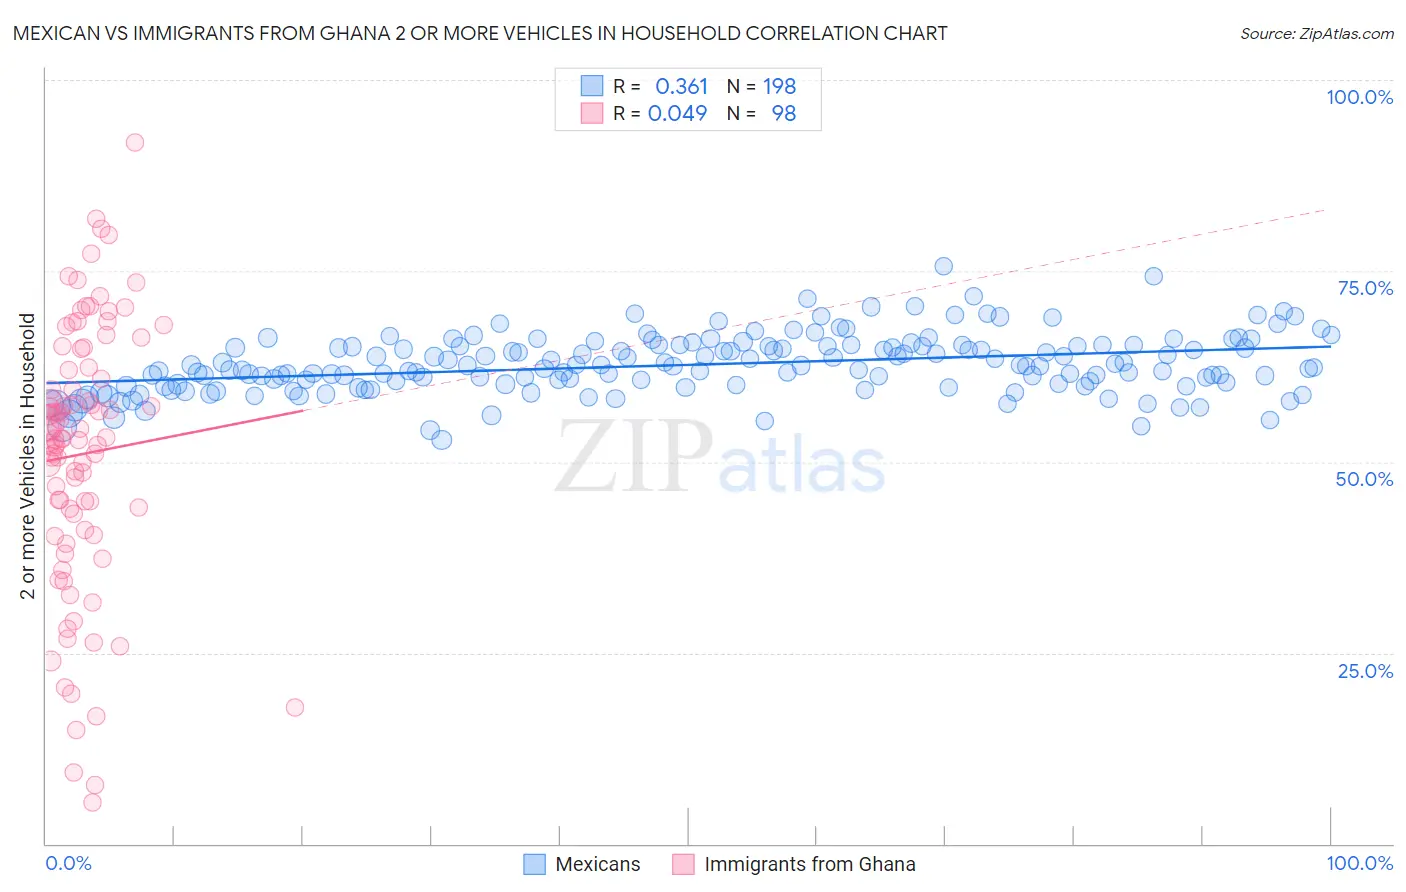
Mexican vs Immigrants from Ghana 2 or more Vehicles in Household Correlation Chart
The statistical analysis conducted on geographies consisting of 536,751,978 people shows a mild positive correlation between the proportion of Mexicans and percentage of households with 2 or more vehicles available in the United States with a correlation coefficient (R) of 0.361 and weighted average of 61.7%. Similarly, the statistical analysis conducted on geographies consisting of 199,813,535 people shows no correlation between the proportion of Immigrants from Ghana and percentage of households with 2 or more vehicles available in the United States with a correlation coefficient (R) of 0.049 and weighted average of 47.4%, a difference of 30.2%.
2 or more Vehicles in Household Correlation Summary
| Measurement | Mexican | Immigrants from Ghana |
| Minimum | 52.9% | 5.4% |
| Maximum | 75.7% | 91.9% |
| Range | 22.7% | 86.4% |
| Mean | 62.7% | 51.0% |
| Median | 62.5% | 53.0% |
| Interquartile 25% (IQ1) | 60.0% | 41.0% |
| Interquartile 75% (IQ3) | 65.2% | 62.3% |
| Interquartile Range (IQR) | 5.2% | 21.3% |
| Standard Deviation (Sample) | 3.8% | 17.5% |
| Standard Deviation (Population) | 3.8% | 17.5% |
Similar Demographics by 2 or more Vehicles in Household
Demographics Similar to Mexicans by 2 or more Vehicles in Household
In terms of 2 or more vehicles in household, the demographic groups most similar to Mexicans are Dutch (61.6%, a difference of 0.050%), German (61.6%, a difference of 0.17%), Swedish (61.8%, a difference of 0.28%), Samoan (61.5%, a difference of 0.28%), and Czech (61.5%, a difference of 0.33%).
| Demographics | Rating | Rank | 2 or more Vehicles in Household |
| Danes | 100.0 /100 | #3 | Exceptional 63.3% |
| Norwegians | 100.0 /100 | #4 | Exceptional 62.8% |
| Immigrants | Fiji | 100.0 /100 | #5 | Exceptional 62.3% |
| Scandinavians | 100.0 /100 | #6 | Exceptional 62.1% |
| Puget Sound Salish | 100.0 /100 | #7 | Exceptional 62.1% |
| English | 100.0 /100 | #8 | Exceptional 61.9% |
| Swedes | 100.0 /100 | #9 | Exceptional 61.8% |
| Mexicans | 100.0 /100 | #10 | Exceptional 61.7% |
| Dutch | 100.0 /100 | #11 | Exceptional 61.6% |
| Germans | 100.0 /100 | #12 | Exceptional 61.6% |
| Samoans | 100.0 /100 | #13 | Exceptional 61.5% |
| Czechs | 100.0 /100 | #14 | Exceptional 61.5% |
| Nepalese | 100.0 /100 | #15 | Exceptional 61.4% |
| Native Hawaiians | 100.0 /100 | #16 | Exceptional 61.4% |
| Basques | 100.0 /100 | #17 | Exceptional 61.4% |
Demographics Similar to Immigrants from Ghana by 2 or more Vehicles in Household
In terms of 2 or more vehicles in household, the demographic groups most similar to Immigrants from Ghana are U.S. Virgin Islander (47.5%, a difference of 0.22%), Haitian (47.6%, a difference of 0.40%), Puerto Rican (47.1%, a difference of 0.57%), Immigrants from Belarus (47.9%, a difference of 1.1%), and Ghanaian (48.0%, a difference of 1.3%).
| Demographics | Rating | Rank | 2 or more Vehicles in Household |
| Hopi | 0.0 /100 | #307 | Tragic 49.0% |
| Albanians | 0.0 /100 | #308 | Tragic 49.0% |
| Moroccans | 0.0 /100 | #309 | Tragic 48.8% |
| Ghanaians | 0.0 /100 | #310 | Tragic 48.0% |
| Immigrants | Belarus | 0.0 /100 | #311 | Tragic 47.9% |
| Haitians | 0.0 /100 | #312 | Tragic 47.6% |
| U.S. Virgin Islanders | 0.0 /100 | #313 | Tragic 47.5% |
| Immigrants | Ghana | 0.0 /100 | #314 | Tragic 47.4% |
| Puerto Ricans | 0.0 /100 | #315 | Tragic 47.1% |
| Cape Verdeans | 0.0 /100 | #316 | Tragic 46.8% |
| Immigrants | Haiti | 0.0 /100 | #317 | Tragic 46.5% |
| Immigrants | Albania | 0.0 /100 | #318 | Tragic 46.0% |
| Jamaicans | 0.0 /100 | #319 | Tragic 45.8% |
| Soviet Union | 0.0 /100 | #320 | Tragic 45.7% |
| Immigrants | Jamaica | 0.0 /100 | #321 | Tragic 44.5% |