Immigrants from Canada vs Immigrants from Ghana 2 or more Vehicles in Household
COMPARE
Immigrants from Canada
Immigrants from Ghana
2 or more Vehicles in Household
2 or more Vehicles in Household Comparison
Immigrants from Canada
Immigrants from Ghana
57.5%
2 OR MORE VEHICLES IN HOUSEHOLD
98.1/ 100
METRIC RATING
108th/ 347
METRIC RANK
47.4%
2 OR MORE VEHICLES IN HOUSEHOLD
0.0/ 100
METRIC RATING
314th/ 347
METRIC RANK
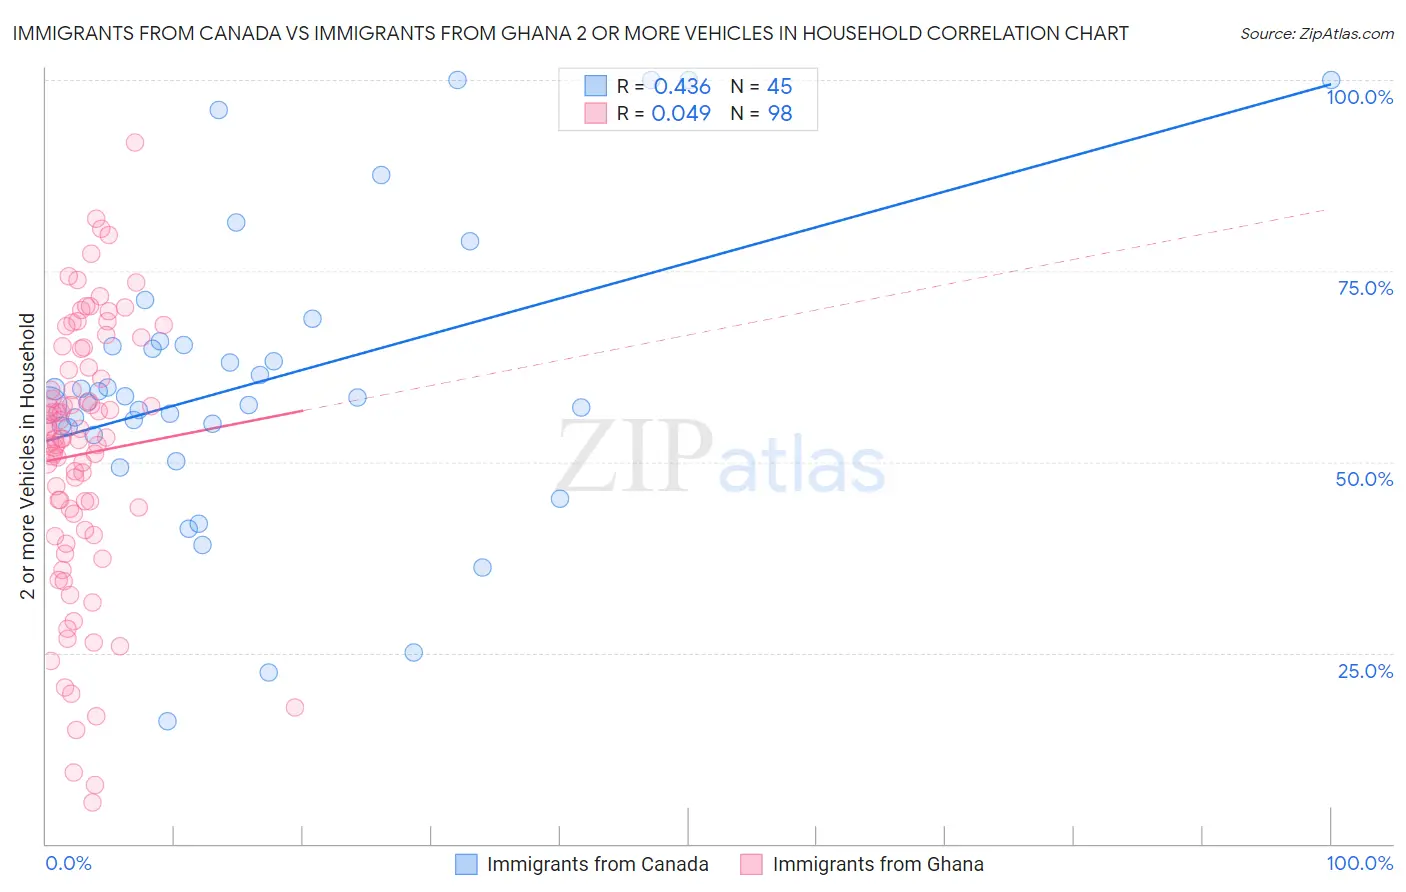
Immigrants from Canada vs Immigrants from Ghana 2 or more Vehicles in Household Correlation Chart
The statistical analysis conducted on geographies consisting of 459,158,975 people shows a moderate positive correlation between the proportion of Immigrants from Canada and percentage of households with 2 or more vehicles available in the United States with a correlation coefficient (R) of 0.436 and weighted average of 57.5%. Similarly, the statistical analysis conducted on geographies consisting of 199,813,535 people shows no correlation between the proportion of Immigrants from Ghana and percentage of households with 2 or more vehicles available in the United States with a correlation coefficient (R) of 0.049 and weighted average of 47.4%, a difference of 21.4%.
2 or more Vehicles in Household Correlation Summary
| Measurement | Immigrants from Canada | Immigrants from Ghana |
| Minimum | 16.0% | 5.4% |
| Maximum | 100.0% | 91.9% |
| Range | 84.0% | 86.4% |
| Mean | 60.6% | 51.0% |
| Median | 58.4% | 53.0% |
| Interquartile 25% (IQ1) | 54.1% | 41.0% |
| Interquartile 75% (IQ3) | 65.5% | 62.3% |
| Interquartile Range (IQR) | 11.4% | 21.3% |
| Standard Deviation (Sample) | 19.4% | 17.5% |
| Standard Deviation (Population) | 19.1% | 17.5% |
Similar Demographics by 2 or more Vehicles in Household
Demographics Similar to Immigrants from Canada by 2 or more Vehicles in Household
In terms of 2 or more vehicles in household, the demographic groups most similar to Immigrants from Canada are Immigrants from Netherlands (57.5%, a difference of 0.010%), Immigrants from Oceania (57.5%, a difference of 0.030%), Immigrants from North America (57.5%, a difference of 0.030%), Immigrants from Bolivia (57.6%, a difference of 0.050%), and Jordanian (57.6%, a difference of 0.050%).
| Demographics | Rating | Rank | 2 or more Vehicles in Household |
| Lebanese | 98.3 /100 | #101 | Exceptional 57.6% |
| Immigrants | Bolivia | 98.2 /100 | #102 | Exceptional 57.6% |
| Jordanians | 98.2 /100 | #103 | Exceptional 57.6% |
| Immigrants | Indonesia | 98.2 /100 | #104 | Exceptional 57.6% |
| Immigrants | Korea | 98.2 /100 | #105 | Exceptional 57.6% |
| Immigrants | Oceania | 98.2 /100 | #106 | Exceptional 57.5% |
| Immigrants | Netherlands | 98.2 /100 | #107 | Exceptional 57.5% |
| Immigrants | Canada | 98.1 /100 | #108 | Exceptional 57.5% |
| Immigrants | North America | 98.1 /100 | #109 | Exceptional 57.5% |
| Japanese | 98.0 /100 | #110 | Exceptional 57.5% |
| Greeks | 98.0 /100 | #111 | Exceptional 57.5% |
| Pueblo | 98.0 /100 | #112 | Exceptional 57.5% |
| Zimbabweans | 96.9 /100 | #113 | Exceptional 57.2% |
| Immigrants | Lebanon | 96.8 /100 | #114 | Exceptional 57.2% |
| Chippewa | 96.6 /100 | #115 | Exceptional 57.2% |
Demographics Similar to Immigrants from Ghana by 2 or more Vehicles in Household
In terms of 2 or more vehicles in household, the demographic groups most similar to Immigrants from Ghana are U.S. Virgin Islander (47.5%, a difference of 0.22%), Haitian (47.6%, a difference of 0.40%), Puerto Rican (47.1%, a difference of 0.57%), Immigrants from Belarus (47.9%, a difference of 1.1%), and Ghanaian (48.0%, a difference of 1.3%).
| Demographics | Rating | Rank | 2 or more Vehicles in Household |
| Hopi | 0.0 /100 | #307 | Tragic 49.0% |
| Albanians | 0.0 /100 | #308 | Tragic 49.0% |
| Moroccans | 0.0 /100 | #309 | Tragic 48.8% |
| Ghanaians | 0.0 /100 | #310 | Tragic 48.0% |
| Immigrants | Belarus | 0.0 /100 | #311 | Tragic 47.9% |
| Haitians | 0.0 /100 | #312 | Tragic 47.6% |
| U.S. Virgin Islanders | 0.0 /100 | #313 | Tragic 47.5% |
| Immigrants | Ghana | 0.0 /100 | #314 | Tragic 47.4% |
| Puerto Ricans | 0.0 /100 | #315 | Tragic 47.1% |
| Cape Verdeans | 0.0 /100 | #316 | Tragic 46.8% |
| Immigrants | Haiti | 0.0 /100 | #317 | Tragic 46.5% |
| Immigrants | Albania | 0.0 /100 | #318 | Tragic 46.0% |
| Jamaicans | 0.0 /100 | #319 | Tragic 45.8% |
| Soviet Union | 0.0 /100 | #320 | Tragic 45.7% |
| Immigrants | Jamaica | 0.0 /100 | #321 | Tragic 44.5% |